George Lea's Squeeze Templates
Template Description
George focuses on stocks that are breaking out from low volatility bases with unusual volume signatures. He applies formulas from reference material published by authors such as Morales and Kacher, John Bollinger, Chester Keltner and Welles Wilder and combines them to give indications of when to buy a stock.
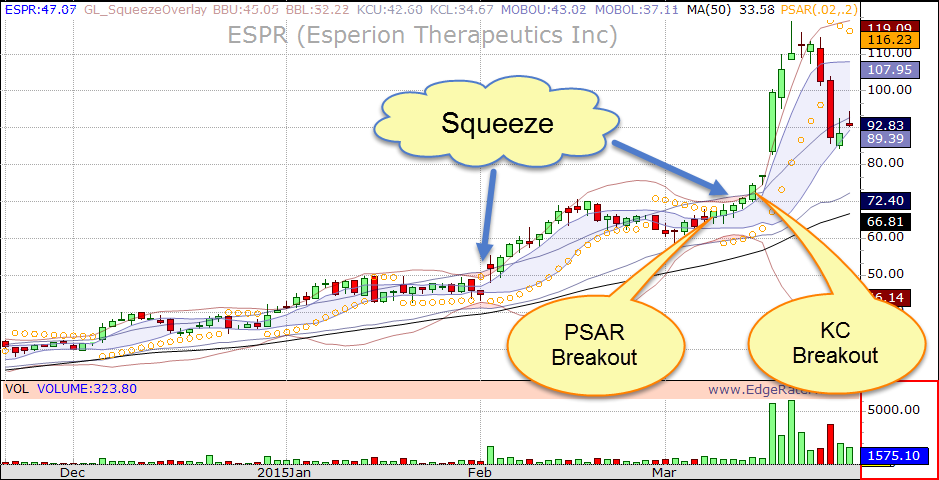
George uses the ‘squeeze’ indicator to identify low volatility bases – the squeeze is on when the Bollinger Bands move inside the Keltner Channels. Once a stock is in a squeeze he then looks for breakouts or breakdowns. The MOBO breakout, PSAR breakout, Pocket Pivot breakout and Keltner Channel breakouts are good entry triggers.
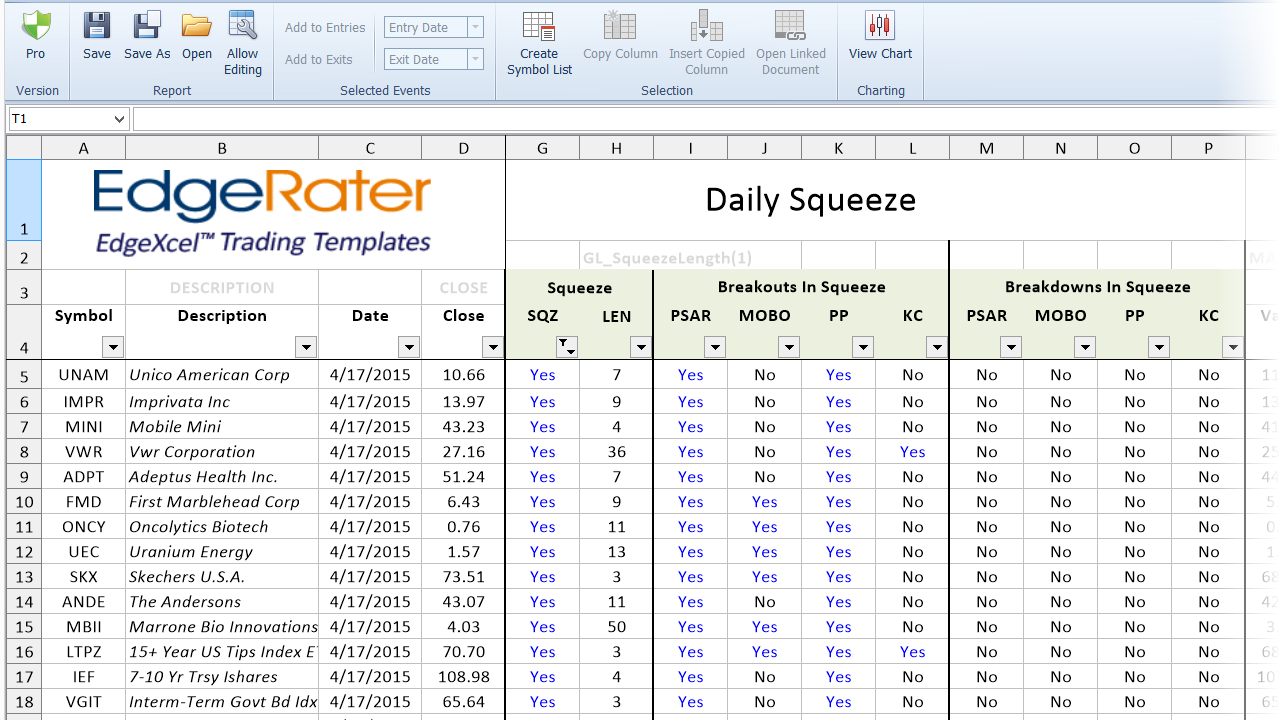
George’s Squeeze templates consist of a Monthly Squeeze template, Weekly Squeeze template and Daily Squeeze template. Each template produces a report which identifies stocks that are currently in a squeeze and are breaking out.
More Info
- CategoryGeorge Lea
- Release DateOctober 2014
- TagsScan, George Lea