Code Red/Blue
Template Description
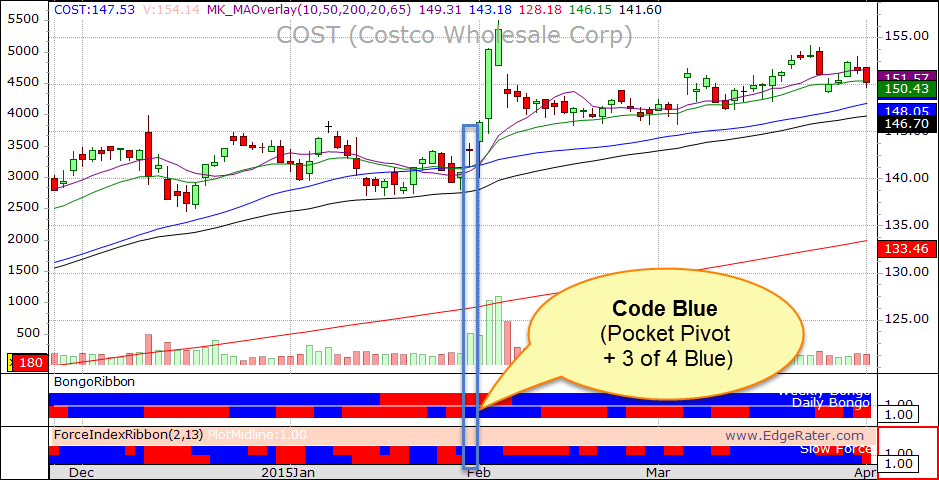
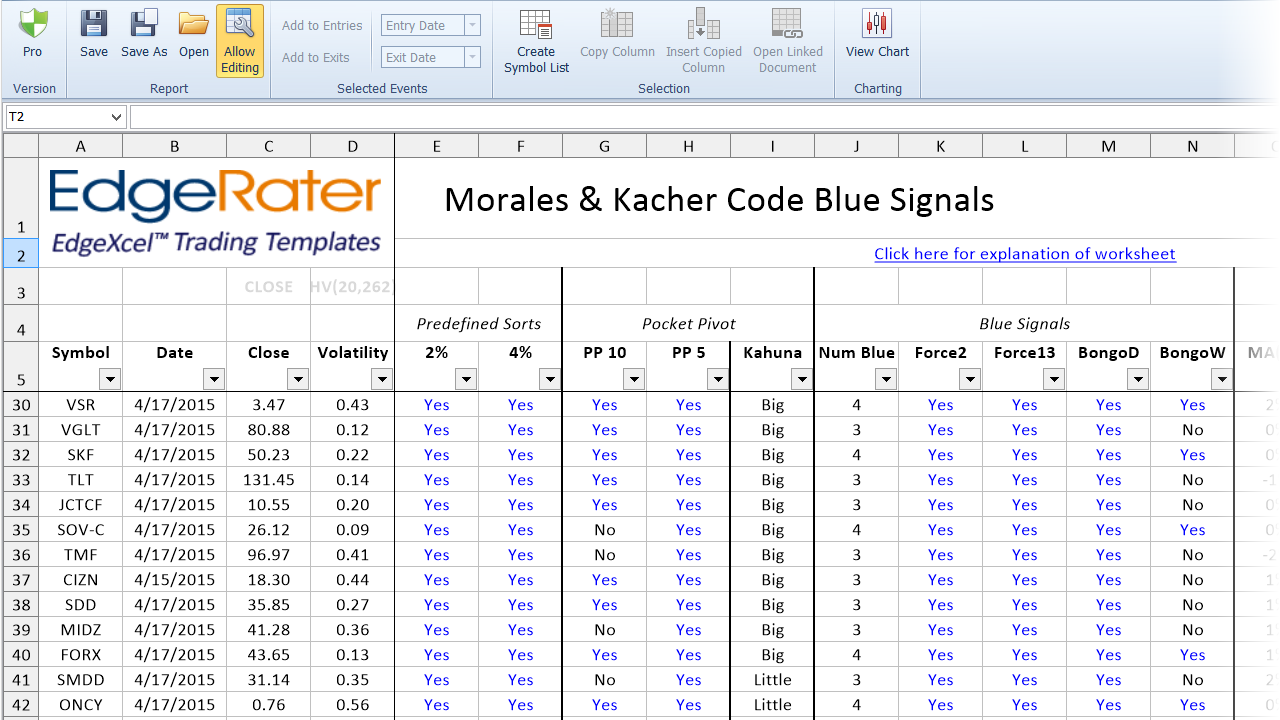
Code Red and Code Blue are bearish and bullish signals respectively. Code Blue occurs whenever 3 out of 4 'blue' indicators fire along with a 5 or 10 period pocket pivot when the stock is tight along one of the moving averages ( SMA 10, 50, 200, EMA 20, 65)
The code red and code blue templates produce reports highlighting stocks that are currently in a code red or code blue state.
More Info
- CategoryMorales & Kacher
- Links
Please subscribe to the EdgeRater YouTube Channel to be notified of new helpful videos