Template Description
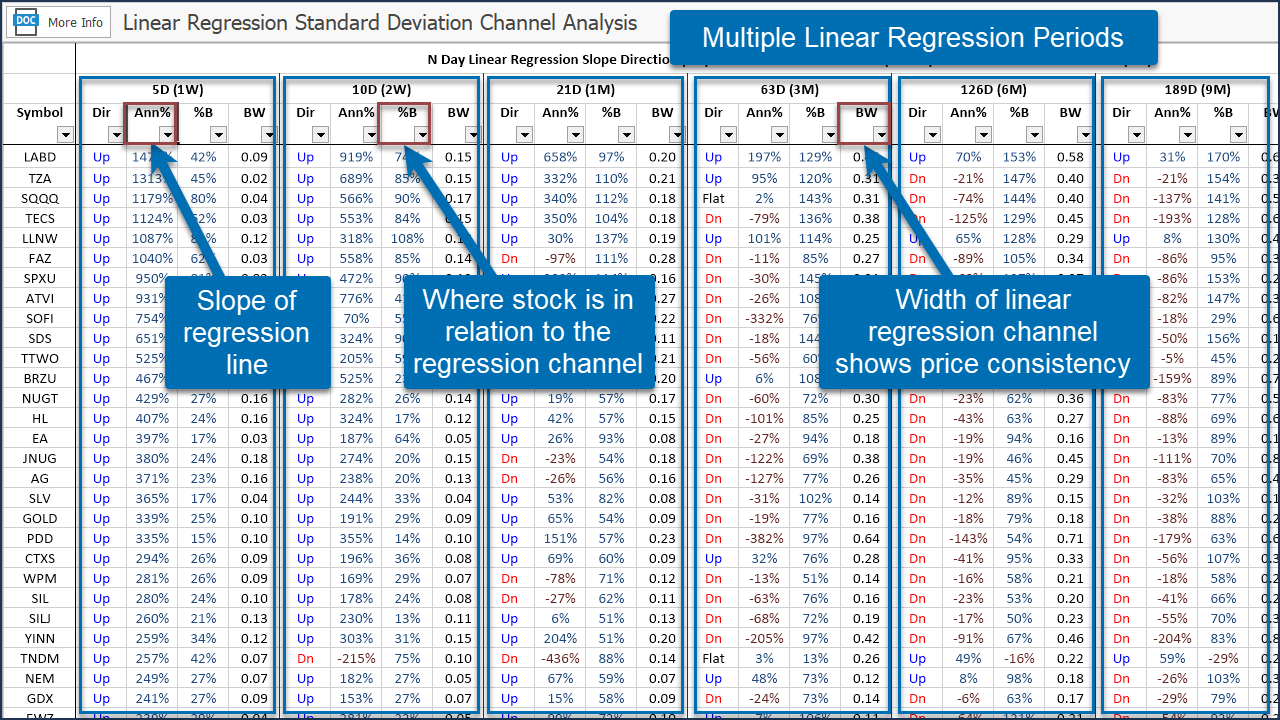
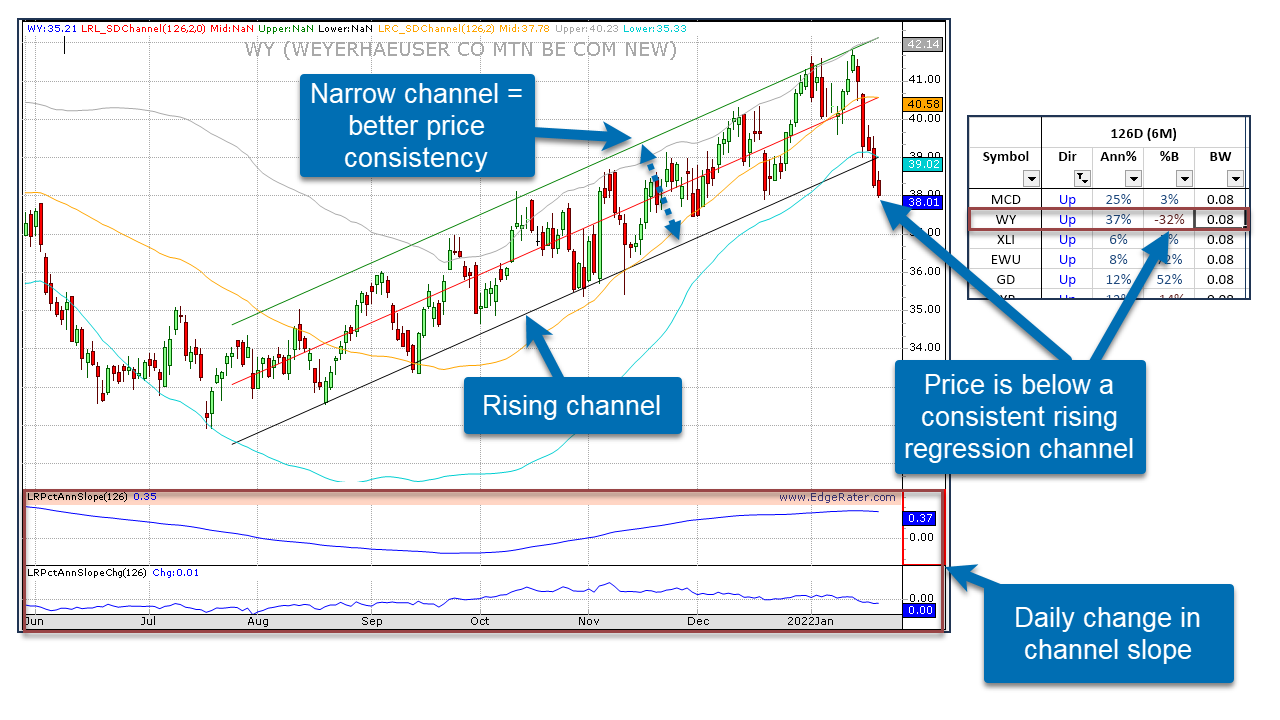
This template shows the daily linear regression line and standard deviation channels along with annualized % slope values for a selection of periods (5 days through 1 Year).
The 2 standard deviation channel upper and lower values are calculated along with a value indicating where the close price is in relation to the bands.
The Annualized slope % is a value which shows where the linear regression line will be in 1 year if it continues on its current trajectory. By annualizing this value it is possible to compare stocks to show which are increasing or decreasing at a greater rates. Also by showing a selection of different periods for linear regression slopes side-by-side it is possible to see which timeframes have the steepest slopes. Therefore this template can be used to uncover a lot of different scenarios. For instance if you want to see stocks that have an upward slope over a 1 year period, a downward slope over a 3 month period and an upward slope over a 10 day period it is easy to do by sorting the columns in the appropriate order.
By default the results are sorted by the 252 Day (1 Year) slope of the linear regression line in descending order which means that stocks that have the best trajectory in the longer time frame rise to the top of the list.