The Good, The Bad and The Ugly
Template Description
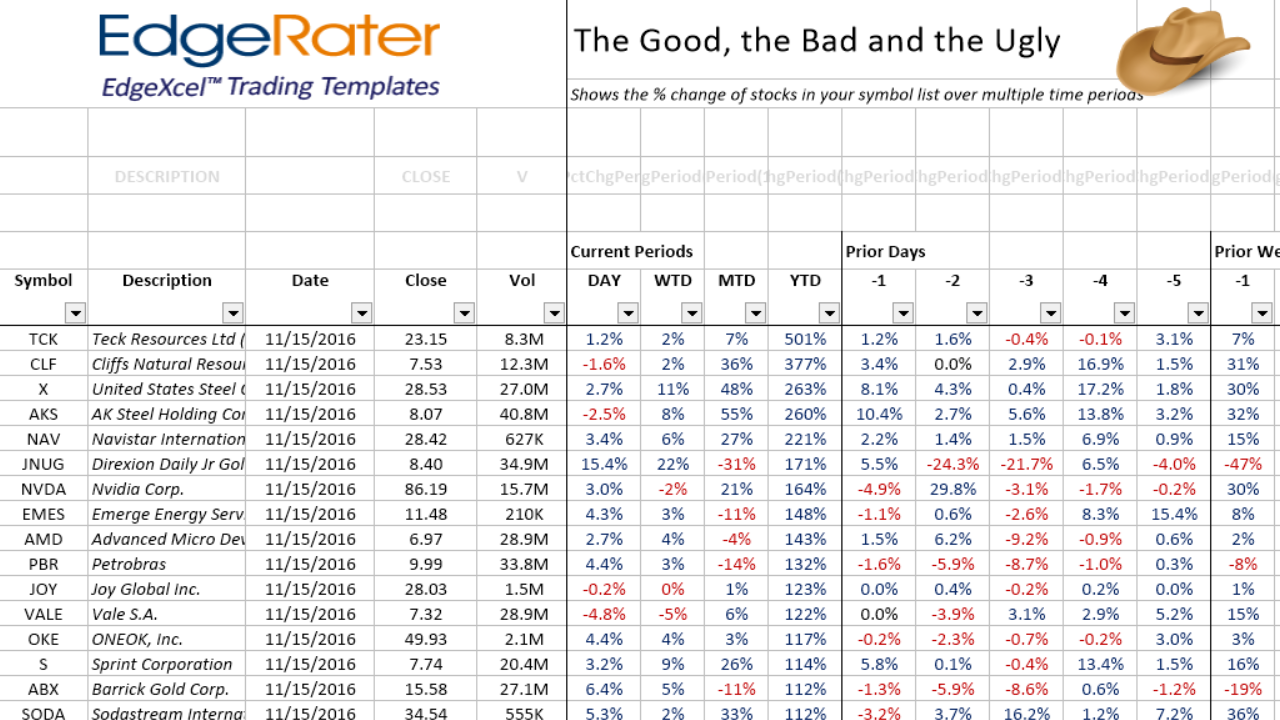
Quickly see the Good, Bad and Ugly stocks from various time periods. For instance, at a glance see what stocks have gained over 100% year-to-date but have been down for the past month. Or find out what stocks performed the worst yesterday but are recovering intra-day today. There are many time frames covered such as current periods of Day, WTD, MTD, YTD along with prior periods of past 5 days, 4 weeks, 12 months and 10 years.
More Info
- CategoryHot Topics
- Release DateNovember 2016
- TagsScan, Performance
Please subscribe to the EdgeRater YouTube Channel to be notified of new helpful videos