Correlation Matrix, Alpha and Beta
Template Description

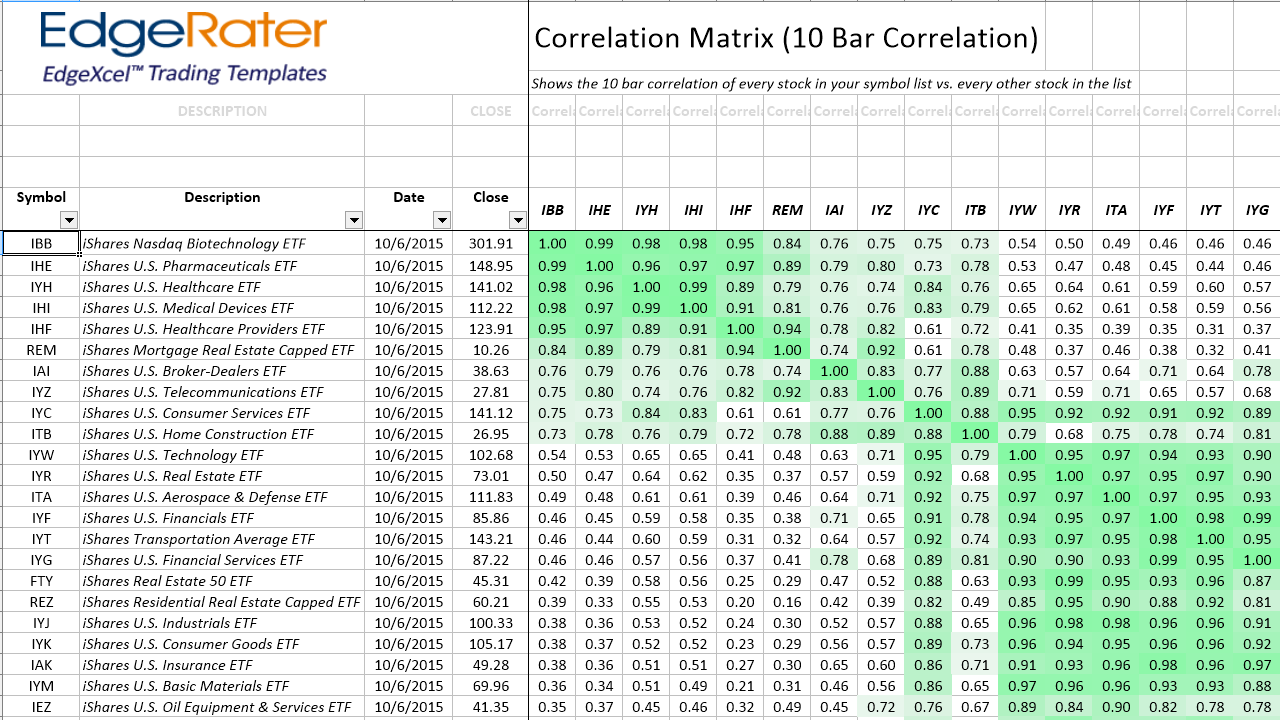
The Correlation Matrix template is a powerful template that produces a report of corrleation values of every stock in your chosen symbol list vs. every other stock in that same list. Run it on a list of 1000 stocks and you will get 1,000,000 reported correlation values.
The report is dynamically filterable and sortable. Click on a symbol in the header row to sort the list by stocks that are most positively or negatively correlated to that symbol. Click on a symbol in the symbol column to sort left to right by the same criteria. Using a combination of these two sorts you can bring closely correlation stocks to the top left quadrant of the report.
You can use correlation to ensure that you are not over exposed in the same type of security. Or to hedge a position with an inversely correlated security. You can find stocks that are inversely correlated to the VIX to take advantage of VIX spikes.
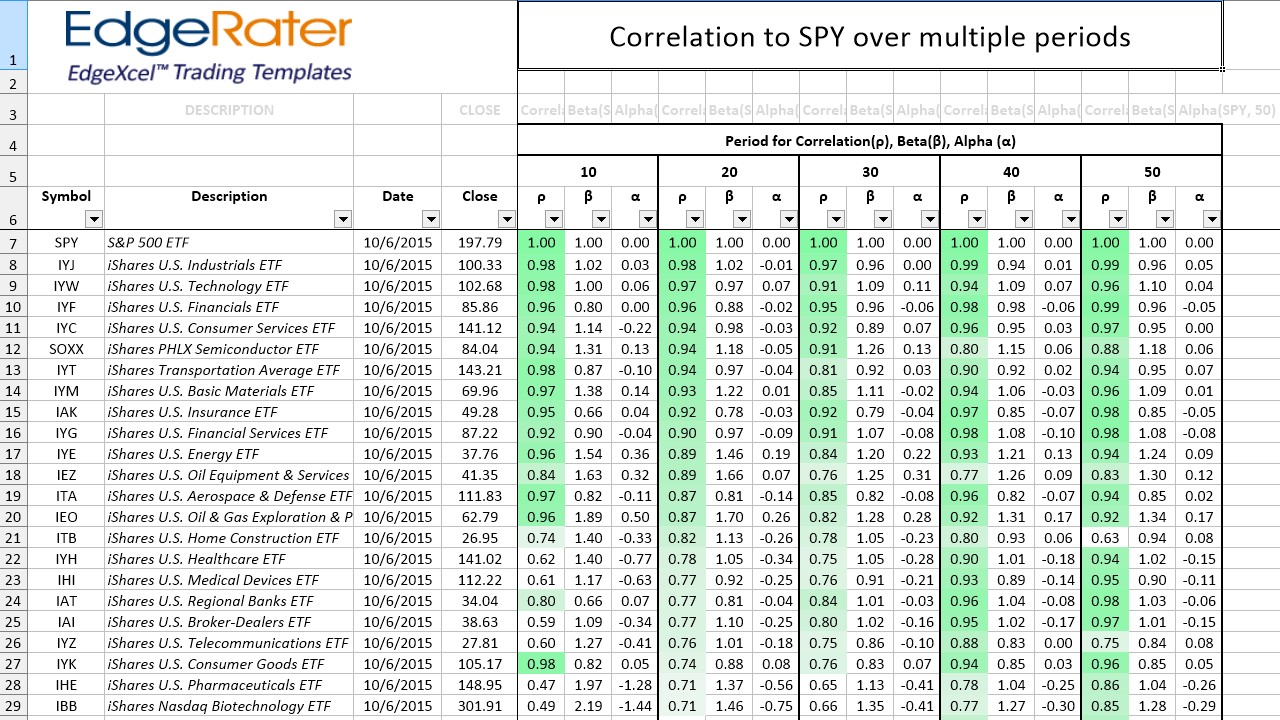
Correlation is only half the story. The other template in the Correlation suite tells you the Alpha and Beta values of your chosen stock vs. every other stock in your symbol list. Beta give you the magnitude of swing of one stock vs another and Alpha gives you the excess returns of one stock vs another.
For example, if you compare to SPY, the 3x inverse ETF will have a correlation of -1 and a Beta value of -3.
More Info
- CategoryPro Tools
- Release DateSeptember 2015
- TagsScan, Pro Tools
- More InfoBlog Post