INTRODUCING THE NEW EDGERATER PRO 2024
More Powerful. More Efficient.
Super-fast backtesting, scanning and market analysis with unique trading templates for every situation.
EdgeRater PRO 2024 data is so UNIQUE, you will not find it in any other program!
Here's the latest feature that has customers excited...
EdgeRater 2024 is now better than ever. Over the last year we have developed some incredible new features:
Here’s a quick rundown of other NEW FEATURES

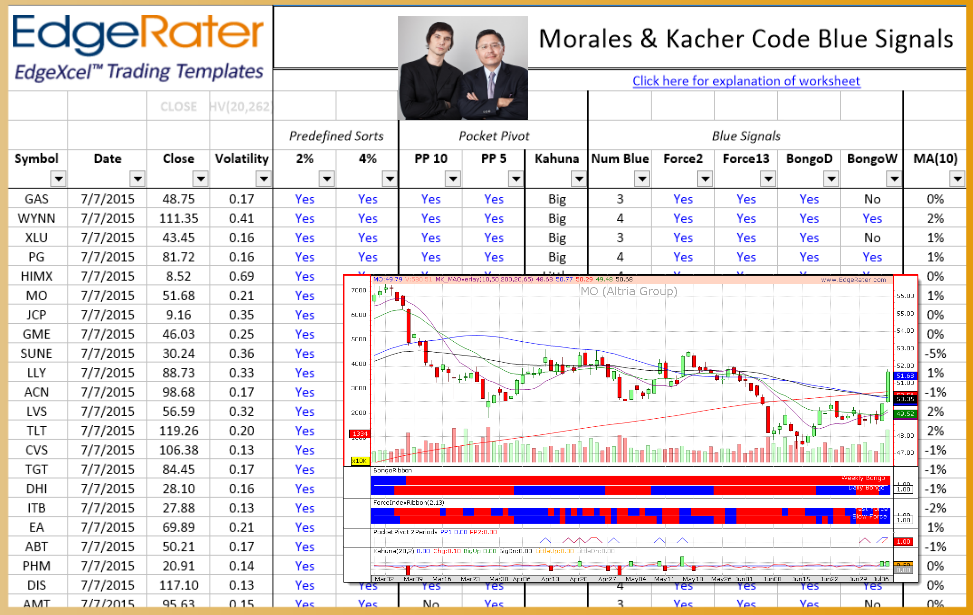
Dr. Ken Long Templates
Templates to identify stocks in 'Compound Critical States' and Swing Trade Signals.
Straddle Busters Template
Which stock's at-the-money straddles are getting busted (an indication of unexpected movement)
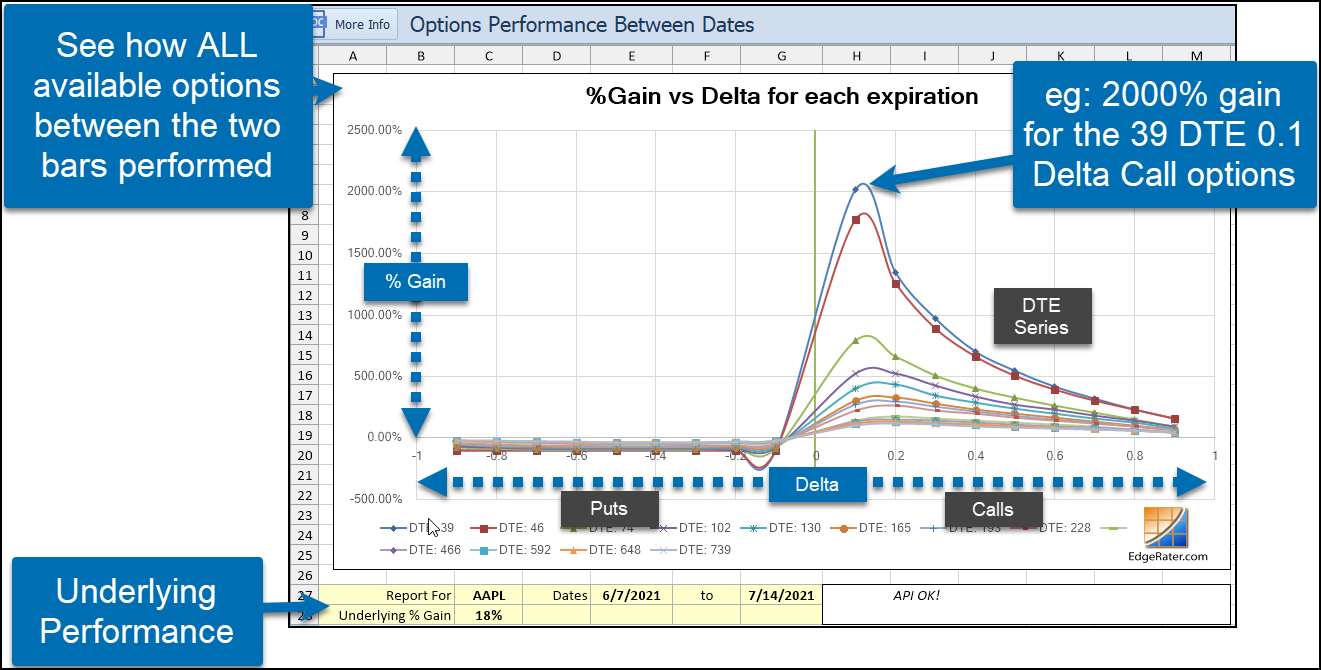
Earnings Moves Template
Reports on the pre-earnings to post-earnings price move for the past 20 earnings releases.
Multi-Factor Trade Analysis Template
Runs monte-carlo simulations on trade simulation reports. Great for finding out how a stock historically performs on every trading day of the year.

Intraday Charts and Good Bad Ugly Report
If you have ThinkOrSwim desktop program and keep it open, EdgeRater will retrieve intraday values and update the chart and the Good Bad Ugly report automatically. More intraday providers to come this year!
EdgeRater PRO 2024 CORE FEATURES
Trading Templates
Trading Templates encapsulate systems, scans, and analysis based on formulas and ideas found in published trading materials. For instance, if you follow Morales & Kacher you can run the template that shows signals based on formulas published in their various books.
Trading Templates can be run inside EdgeRater PRO with the press of a single button and provide interactive scans and reports on the stock market. Results are displayed in a built-in spreadsheet viewer. When you navigate around a report the relevant stock chart will update immediatedly showing you the chart of the symbol with the relevant date highlighted. There are currently over 100 templates in the program with more being added all the time
See The Templates
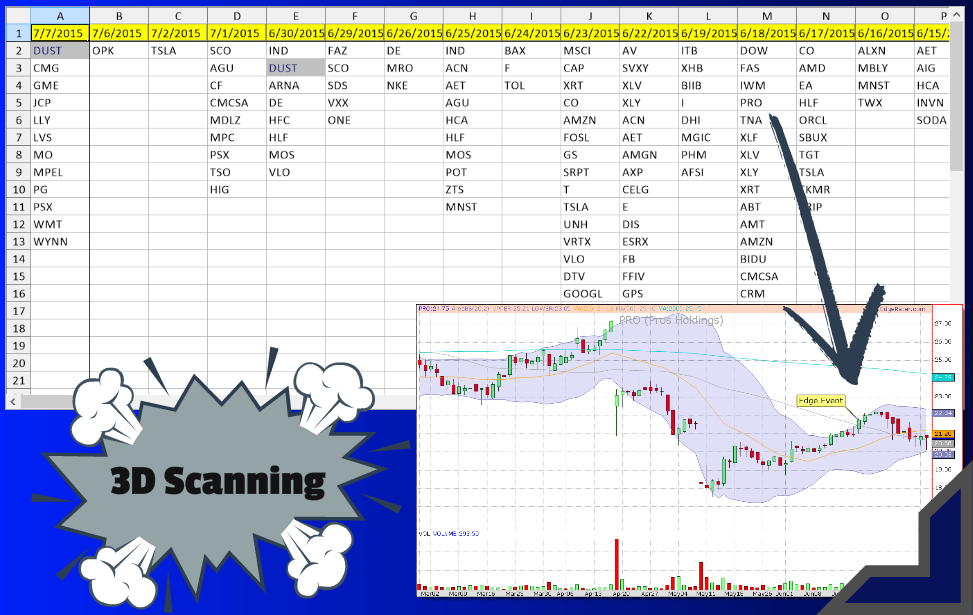
3D Scanning
3D Scanning is a unique approach to scanning stocks pioneered by EdgeRater. Most programs can show stocks that are meeting today's scan criteria. 3D Scanning shows those stocks and also shows the stocks that met the scan criteria for every single historical day, all on one screen with the press of a single button.
Now if you are looking to see how stocks react after your chosen technical event you don't have to wait days to find out. You just look back through the report, click on the scan result and you will see the exact event and date highlighted on your stock chart. Outstanding!
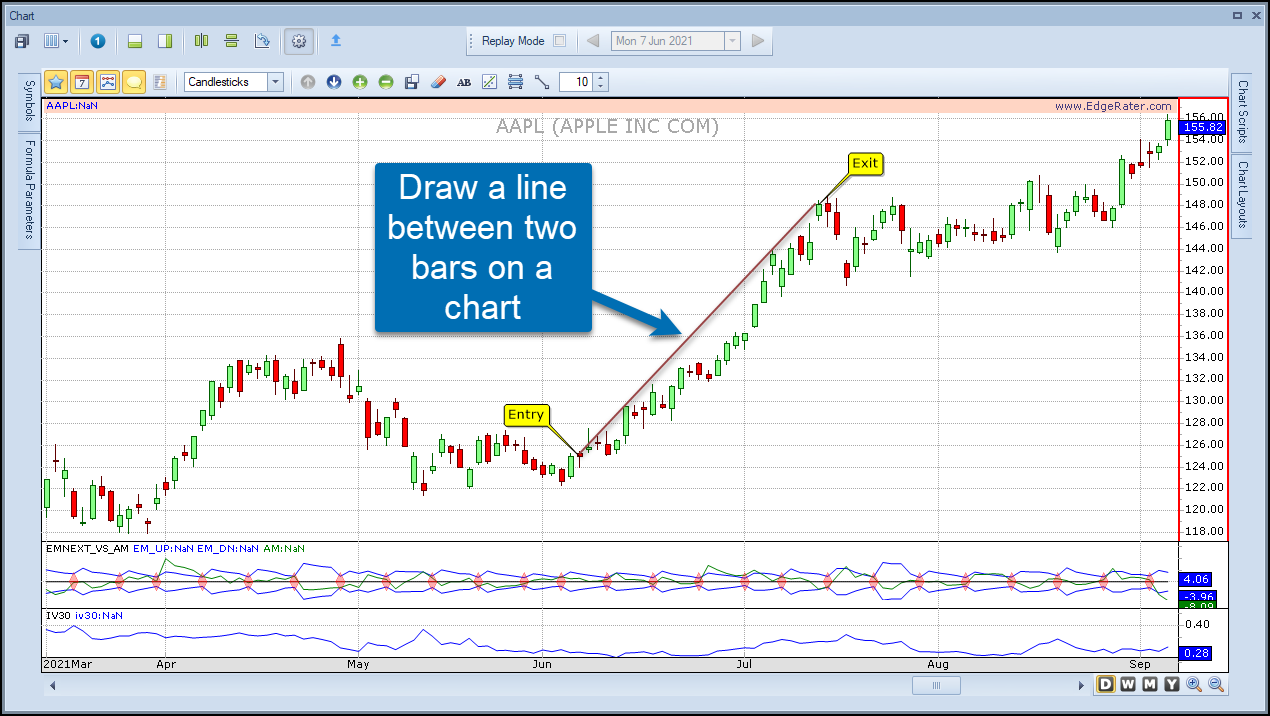
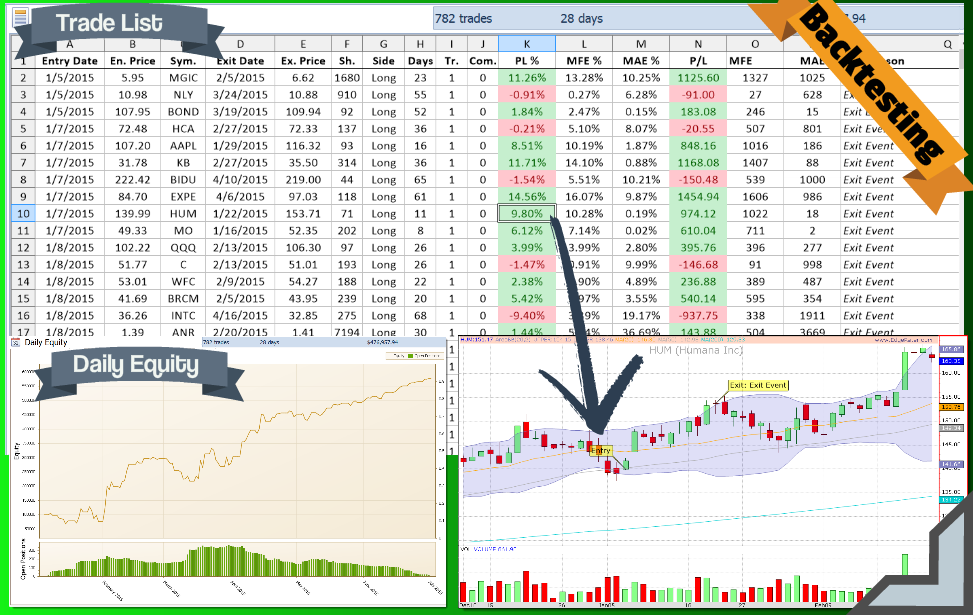
Backtesting
EdgeRater PRO's backtesting capability is designed with the 'visually oriented' in mind. You specify an entry event and an exit event and then use the Trade Simulation feature to backtest all stocks in your symbol list over your chosen time period.
A comprehensive trade report is generated showing the trade list, daily equity curve, frequency distribution chart and trade summary.
You can navigate around the generated report and see each trade highlighted on a stock chart showing the entry, exit and reason for exit (eg. Stop loss exit).
If you have many simulations to run you can put together a batch template and run them all in one go, for instance to test variations in a particular parameter.
SCANNING for stocks using EdgeRater templates
Simple templates built using Excel allow you to scan thousands of stocks for your specific criteria.
Here's how it works...
This is a simple stock scanning template built using Excel:
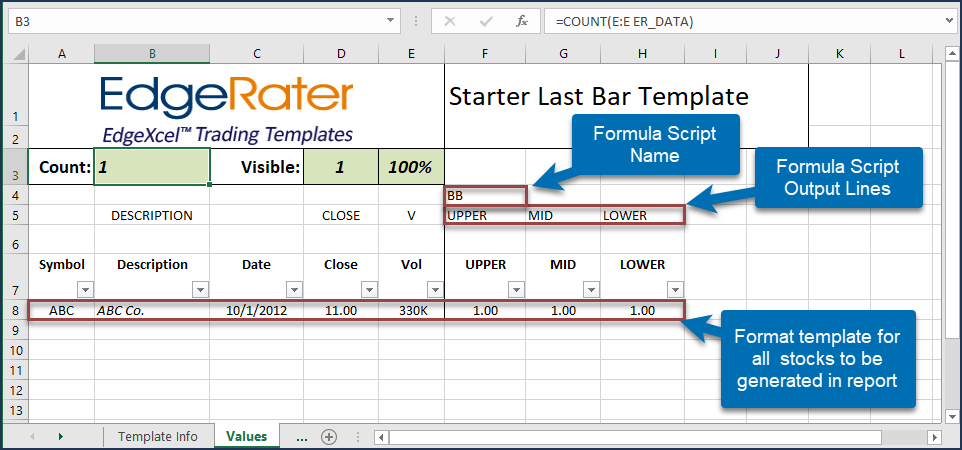
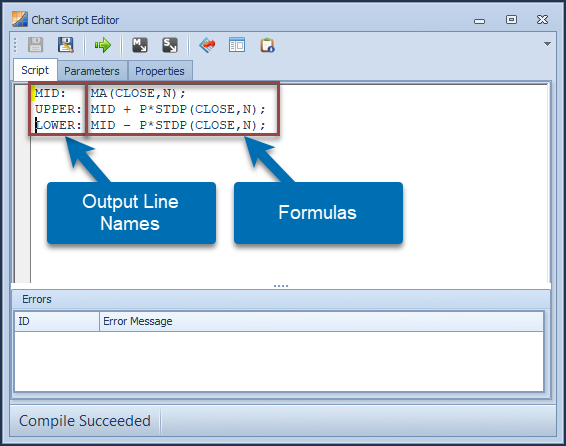
The formula script names in the Excel Template refer to formula scripts in EdgeRater, here's the BB (Bollinger Band) script:
After running this template in EdgeRater, the following report is produced showing the script values for the last bar of each stock:
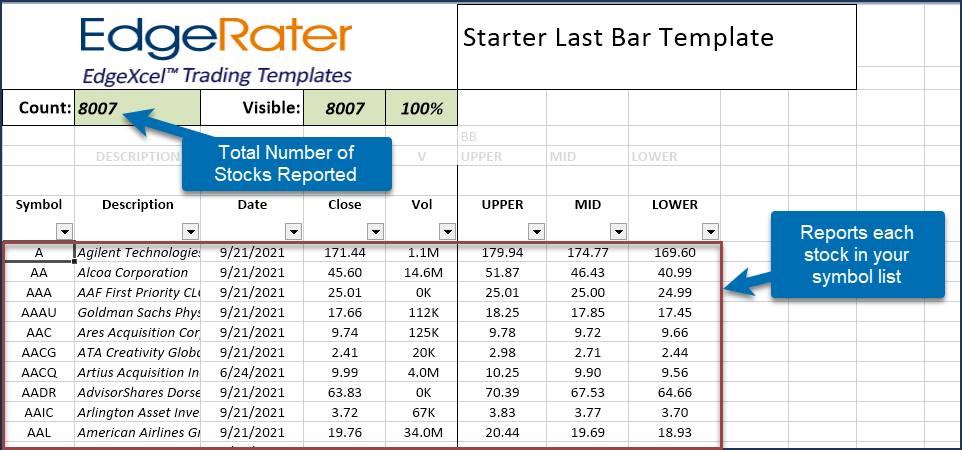
Formats and Formulas used in the Excel Template carry over to the reports:
Reports are linked such that if you have multiple reports showing, as you navigate to a stock in one report the others automatically scroll that stock to the top of the report:
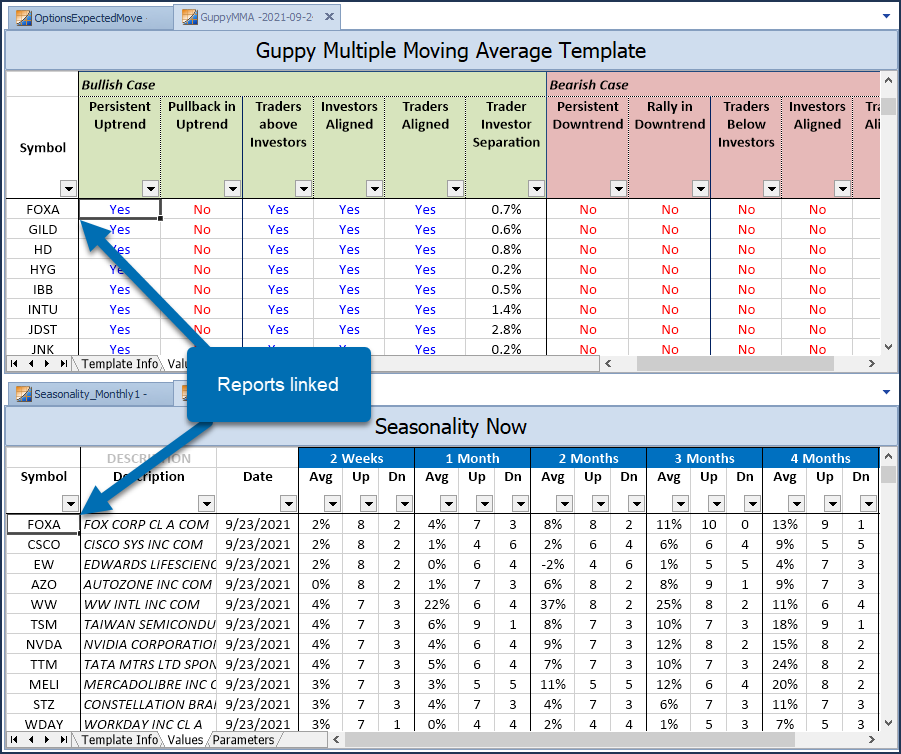
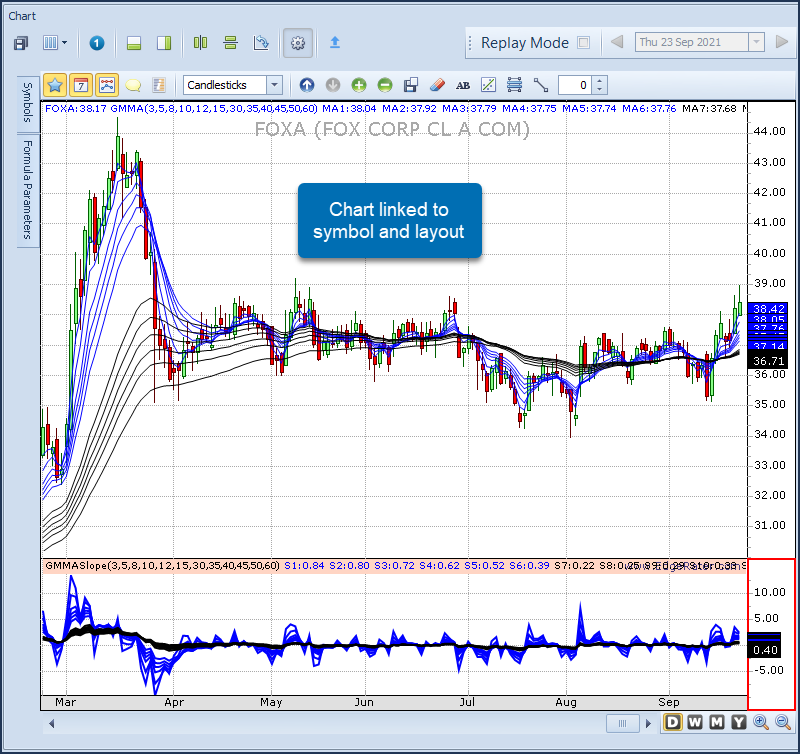
Reports are also linked to charts and can have specific indicator layouts, clicking a stock in a report shows the chart defined for that report:
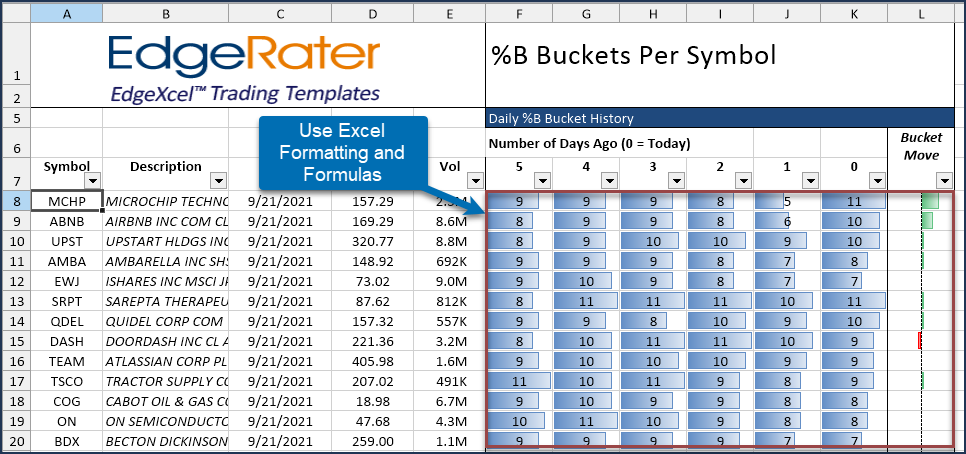
There are hundreds of tried-and-tested built-in templates and if you use only these you don't need Excel. You can also create your own scanning templates using Excel.
But That's Not All...
Scanning Templates are just one of the many features of EdgeRater. EdgeRater is great at backtesting strategies, analyzing patterns to see if an edge exists, informing you of expected move in a stock based on options pricing and keeping you alert to great options trading possibilities based on implied volatility.
To find out more, take the free 14 day unlimited feature trial and experience it for yourself.