Wednesday, July 28, 2010 10:48 AM
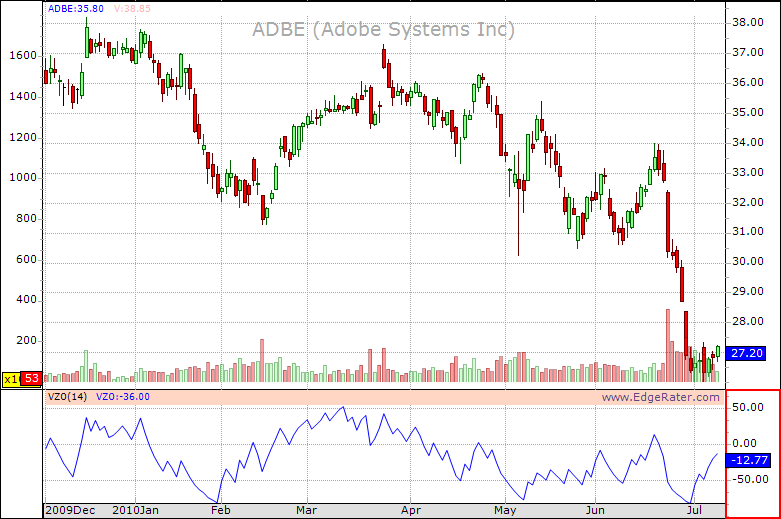
Hi Chris, Dave Steckler had a chart displayed with Volume Zone Oscllator ( VZO ). I have copied Equis Metastock Indicator builder formula from the theses;
Code: Select all
Period:=Input("y",2,200,14);
R:=If(C>Ref(C,1),v,-v);
VP:=Mov(R,Period,E); ( Edge; EMA(R,period)
TV:=Mov(V,period,E);  (Edge; EMA(V,period)
VZO:=100*(VP/TV);
VZOWednesday, July 28, 2010 10:48 AM
Hi Gurjit,
One way to code this in Chart Script is like this:
Code: Select all
PERIOD:=14;
R:= If (C > Ref(C, 1), V, -V);
VP:= EMA(R, PERIOD[0]);
TV:= EMA(V, PERIOD[0]);
VZO: 100 * (VP / TV);

Once you add the parameter, you can use it within your script like this:
Code: Select all
R:= If (C > Ref(C, 1), V, -V);
VP:= EMA(R, PERIOD);
TV:= EMA(V, PERIOD);
VZO: 100 * (VP / TV);
Hope that helps!
Chris.
