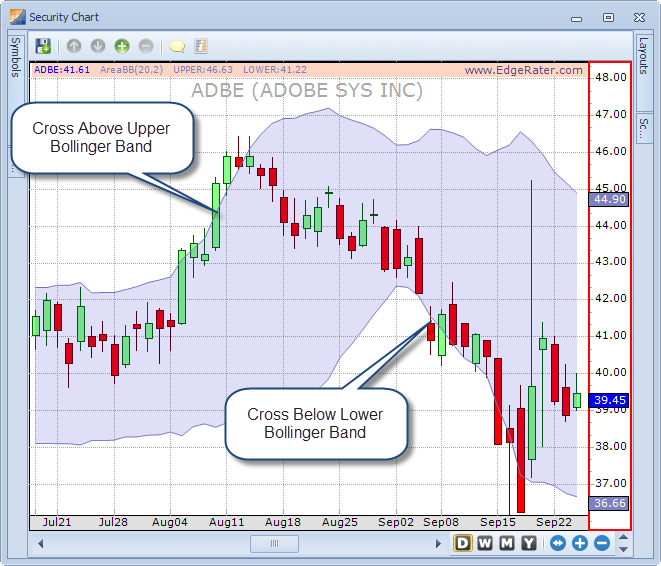
This quick-start tutorial will lead you through the process of generating entry signals for stocks which cross their upper Bollinger Band and exit signals for stocks which cross their lower Bollinger Band:
You won't just find out the results for a single stock, but for every stock in the current snapshot. That could potentially be thousands of stocks and you could run the analysis over many years. In this example we are going to use the installed sample data snapshot which contains approximately 500 stocks, and we are going to run the test over an 18 month period. You will be amazed at the processing power and speed - on a regular Windows 7 installation, the scan and results will be complete in under 1 second.
To sum up our plan:
Entry criteria: Stock crosses above upper Bollinger Band (using default parameters of 20, 2)
Exit criteria: Stock crosses below lower Bollinger Band (using default parameters of 20, 2)
Number of stocks: 498 (S&P 500)
Stock Data*: The historical sample data included with EdgeRater PRO
*Note that EdgeRater can access many different sources of data to give you the latest signals but to keep this tutorial consistent for everybody a default canned set of historical data is being used.
So, let's get started - follow along with this guide.