The chart is divided up into multiple ‘Chart Areas’. Each of these areas can be populated with different indicators and scans.
Task: Add the Aroon indicator to the chart.
Step:
Locate Aroon in the list of system indicators
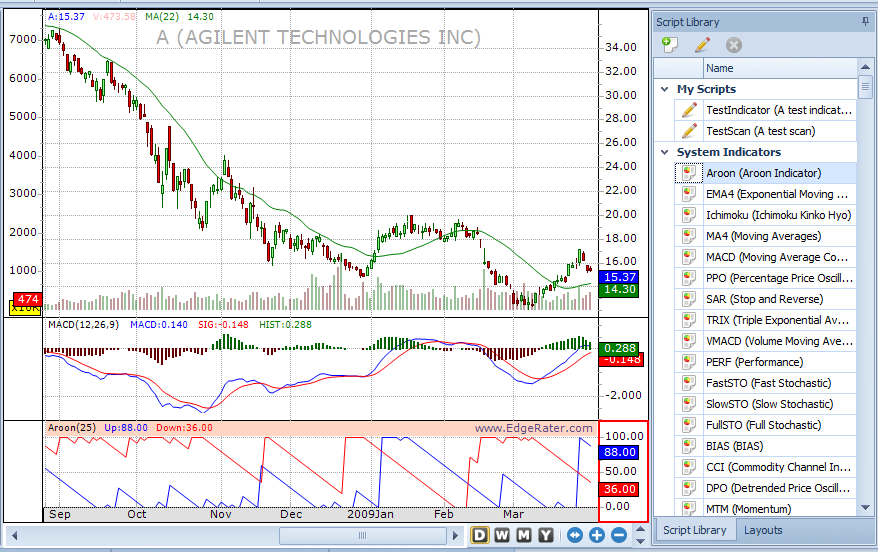
Double-click the Aroon indicator to add it into a brand new chart sub area:
Chart after Aroon has been added via double-click
Indicators can be added to an existing chart area by dragging and dropping onto that area.
Task: Add a Moving Average indicator to the main chart area
Step:
Locate the ‘Moving Average’ indicator in the list of system indicators and drag it onto the main chart area. Note that a new moving average line is now plotted in that area.
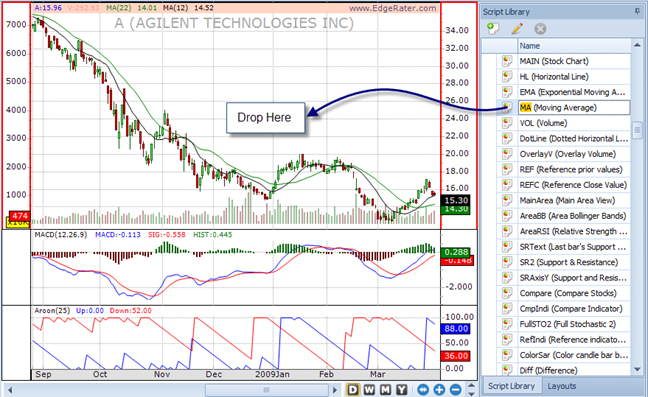
Chart after Moving Average dragged into main chart area
Task: Change the period of the Moving Average
Step:
Open up the ‘Area Properties’ panel and make sure that the main chart area is selected. Change the value ‘N’ of the Moving Average indicator to 50 and watch the plotted moving average line change to reflect the new parameter value.
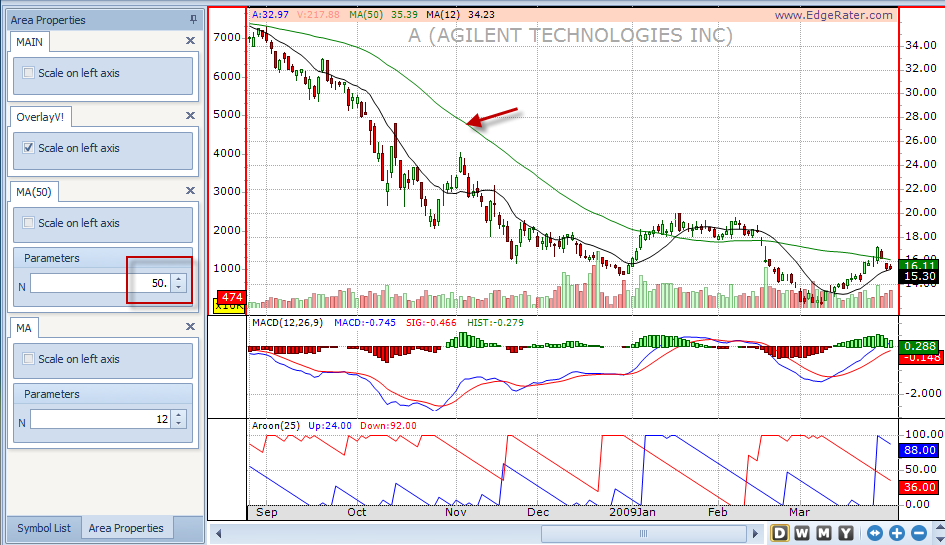
Chart after Moving Average period changed to 50