
At the recent HGSI Insiders roundtable Gil Morales discussed his ‘Code Blue’ technique for finding stocks for potential bullish trades.
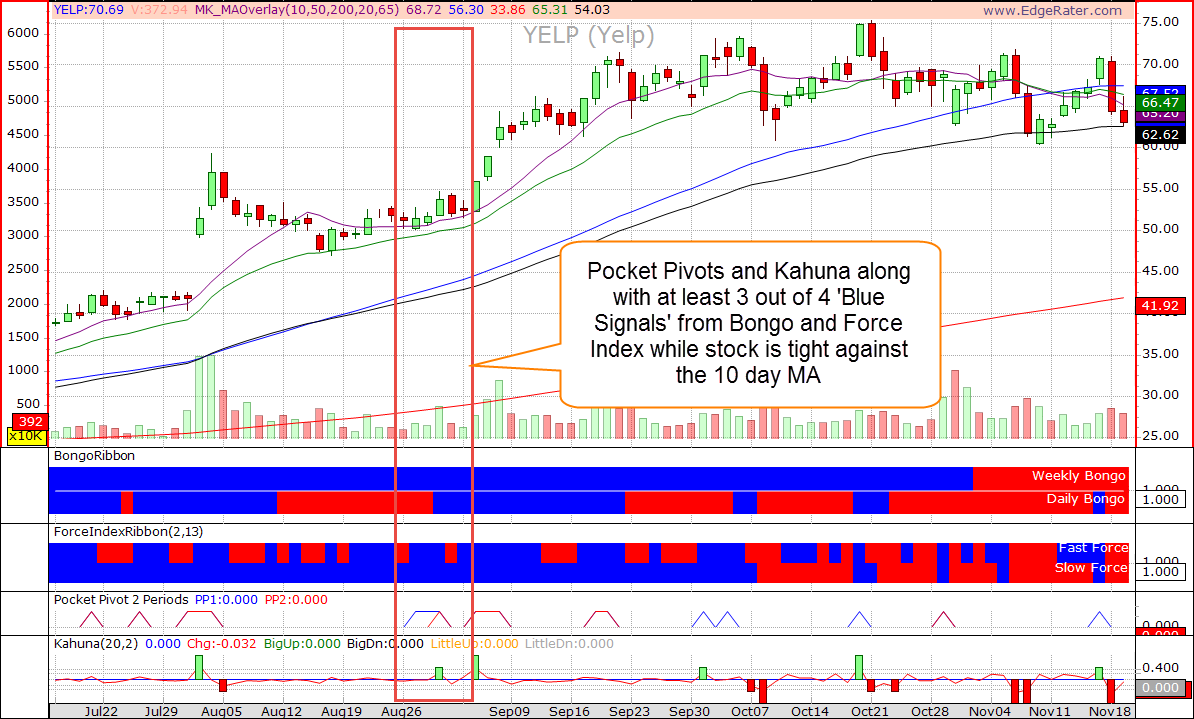
He described searching for stocks that have a 5 bar or 10 bar Pocket Pivot and which have 3 out of 4 of the ‘blue ribbons’ turned blue. Also Gil would be looking for stocks that are tight against one of the following moving averages: 10, 50, 200 Day simple moving average or 20, 65 day Exponential moving average.
Here’s what that might look like:
The new ‘Code Blue’ template and corresponding Chart Layout in EdgeRater allow you to scan for these setups.

The ‘Predefined Sorts’ bring the following stocks to the top of the list:
Predefined Sort 2%
- Stock has a 5 or 10 day Pocket Pivot today
- Stock has at least 3 out of 4 of the ‘Blue’ signals (Force 2, Force 13, Bongo Weekly, Bongo Daily)
- Stock has a low today that is at most 2% higher than one of the following moving averages (SMA 10, 50, 200, EMA 20, 650)
Predefined Sort 4%
- Stock has a 5 or 10 day Pocket Pivot today
- Stock has at least 3 out of 4 of the ‘Blue’ signals (Force 2, Force 13, Bongo Weekly, Bongo Daily)
- Stock has a low today that is at most 4% higher than one of the following moving averages (SMA 10, 50, 200, EMA 20, 650)
Using this template you can quickly see which stocks in your symbol list are exhibiting ‘Code Blue’ and thus setting up for potential long side trades.
There is also a corresponding Chart Layout under the ‘Morales & Kacher’ layouts called ‘Code Blue’ that shows the indicators used to generate the signals:
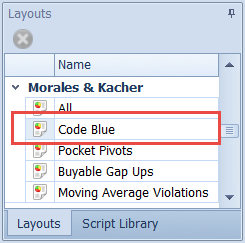
Selecting this layout will display the chart shown in the first image in this post.
The Code Blue template can be found in the ‘Morales & Kacher’ category and is also listed under the ‘HGSI Category’.