
A Linear Regression line is a line of best fit among a contiguous selection of stock prices. It is a statistical way of drawing a trend line and uses the least squares mathematical formula. Once the best fit line has been drawn it is possible to determine the standard deviation of the stock price from the line. Standard deviation channels can then be drawn equidistant from the linear regression line. A 2 standard deviation channel will contain 95% of all the stock prices and a 1 standard deviation channel will contain 68% of all prices.
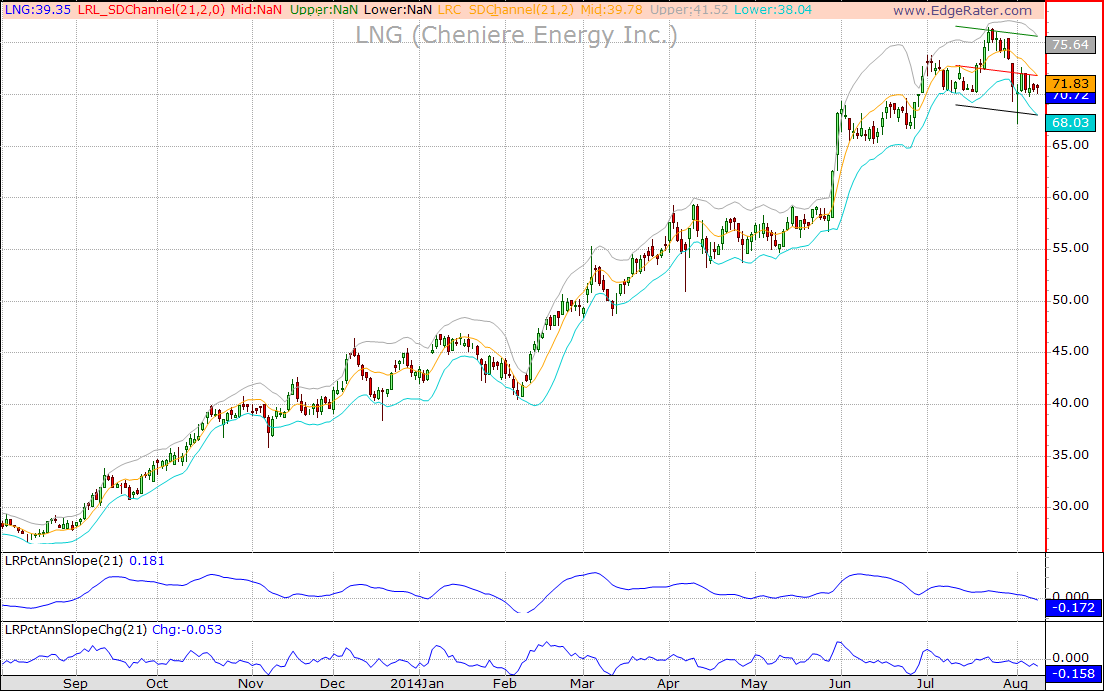
Here’s an example of a 252 day linear regression line with a 2 standard deviation channel:

A 252 day Linear Regression Line chart with a 2 standard deviation channel.
Period of the Linear Regression Line
The one parameter you need to draw a linear regression line is the period of the line. The period indicates how many bars should be taken into account when calculating the line using the least squares method. The fewest number of bars you need to calculate a linear regression line is two, in which case the line will start at the first close and end at the second close. There is no maximum number of bars. Longer lines indicate longer term trends and shorter lines indicate shorter term trends. A 252 day line equates to a one-year trend as there are approximately that number of trading days in one year.
Here’s the same chart as above but with a 21 day linear regression line shown:
A 21 day linear regression line with a 2 standard deviation channel
Slope of the Linear Regression Line
An interesting property of the line is the Slope which is the rise-over-run of the line. For instance if the 20 day linear regression line starts at a value of 100 and ends at a value of 110 the slope of the line is:
(110 – 100)/20 = 0.5
The value of the slope indicates line direction and steepness, however it is not so useful for comparing the trend strength of different stocks due to being based on price rather than percentage. For instance, compare the value of slope for a 20 day line which starts at 1000 and ends at 1010:
(1010 – 1000)/20 = 0.5
It has the exact same slope value but the percentage increase is much lower.
A more useful way to compare slopes among different stocks is to use a percentage value. EdgeRater has developed a value which is a forecast % of a 1 year period, meaning that if the line continued on for another year at the current slope rate it would be X% higher than it is today (or X% lower for negative slopes).
In the above charts you can see 2 indicators in the lower area:
LRPctAnnSlope: This is the forecast annualized % increase or decrease in the line end value
LRPctAnnSlopeChg: This is the change in annualized slope value from the previous day.
Linear Regression Curve
The linear regression line is redrawn every day which changes its slope and also changes the standard deviation channel width. It is useful to plot the end value of the line and channels for each prior day and also view the slope value and slope change for each prior day.
The following chart shows the Linear Regression Curve. The Linear Regression Line for one of the bars has been super-imposed to show where it was at that time. You can see that the end value of the line sits right on the curve:
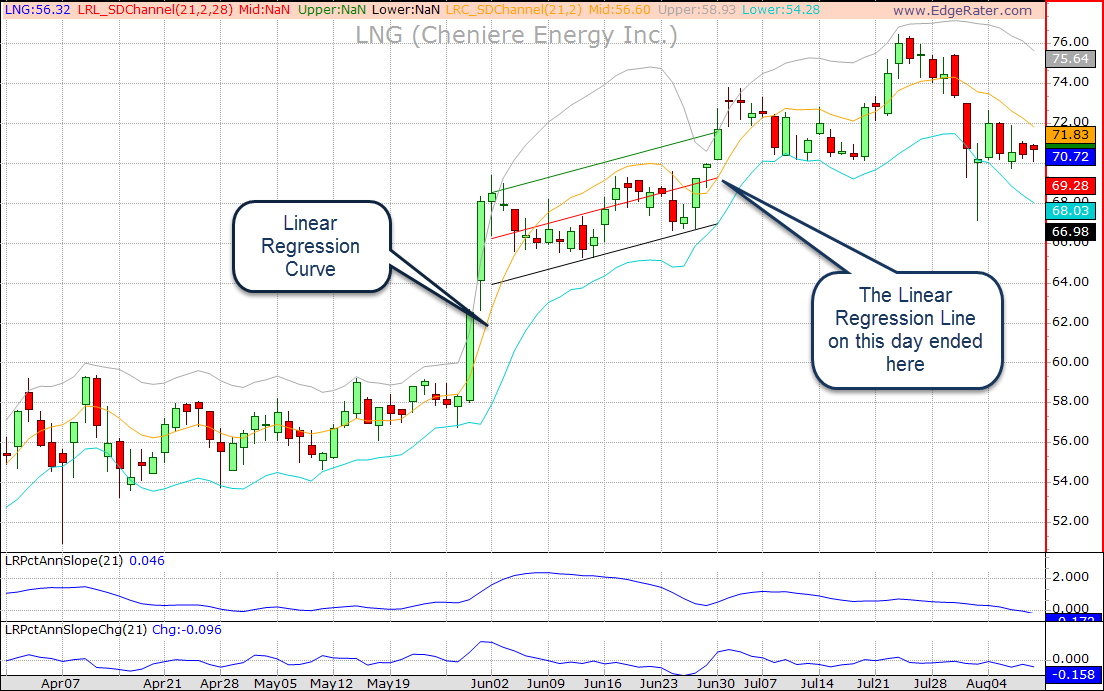
The 21 day Linear Regression Curve with Linear Regression Line superimposed on a prior bar
Analyzing Linear Regression Channels with EdgeRater
The EdgeRater template ‘Linear Regression Channel Analysis’ can be used to produce an Excel report showing Linear Regression Channel values for each stock in your symbol list. You can navigate through this report while viewing it in EdgeRater to see updated charts.
Here’s a video that explains more: