The Trade Summary report details the overall statistics for this strategy and provides numbers that you can use to determine whether one strategy is more suitable to your trading style than another.
Step: Select the ‘Trade Summary’ report from the trade simulation navigation bar
Trade Simulation Navigation Bar – Click on Trade Summary
The following report will be shown:
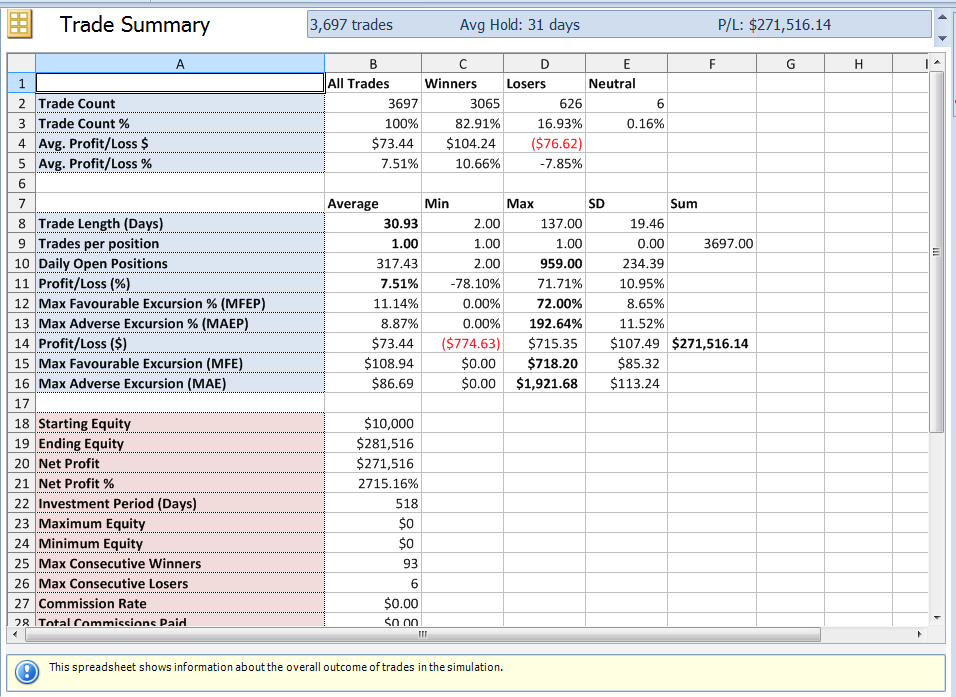
The Trade Summary report
You can see that this particular strategy had a high percentage of winning trades (83%) which we already had determined visually by looking at the Next N Bars report. But this summary also shows us other key statistics about the overall simulation. The Maximum Adverse Excursion of any individual trade was $1921 and the maximum portfolio drawdown can be seen by scrolling the view down to arrive at the number $58,933. These numbers are important in determining if a particular trading strategy meets your requirements.