If a formula line is an output line to be displayed in a chart area (ie, it uses the ":" as opposed to ":=" syntax), it can also contain display attributes that control how the data is actually displayed. Attributes are specified by adding a comma to the end of the line followed by a list of desired attributes. If no attributes are specified, the data is displayed as a solid line that connects each of the data points.
Here are some examples of possible attributes along with screen shots of the resulting output. For a complete list of attributes see the attribute reference.
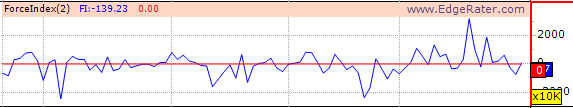
No attributes:
FI: EMA(RAW, N);
ForceIndex without specifying attributes
Width attribute
FI: EMA(RAW, N),Width2;
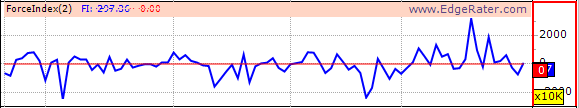
ForceIndex with Width set to 2
Width and Color attribute
FI: EMA(RAW, N),Width2,ColorGreen;
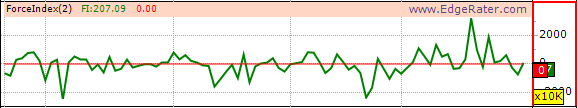
ForceIndex with Width set to 2 and Color set to Green
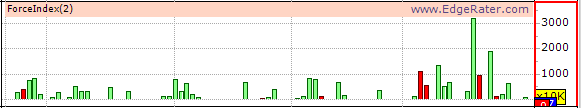
ColorStick attribute
FI: EMA(RAW, N),ColorStick;
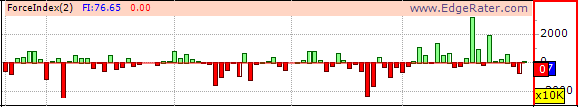
ForceIndex with ColorStick attribute
The output is displayed as sticks, with positive values colored green and negative values colored red.
VolStick attribute
FI: EMA(RAW, N),VolStick;
 ForceIndex with VolStick attribute
The output is displayed as sticks, but only positive values are shown, the stick is colored green if the close price of the stock was higher than the previous day, and red if the close price was lower (the VolStick attribute is primarily intended for use with the Volume formula)
CircleDot
FI: EMA(RAW, N),CircleDot;
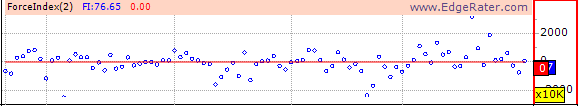
ForceIndex with CircleDot attribute
CrossDot
FI: EMA(RAW, N),CrossDot;
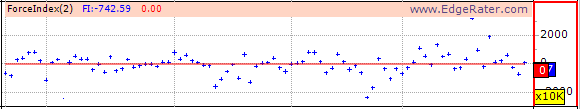
ForceIndex with CrossDot attribute
PointDot
FI: EMA(RAW, N),PointDot;
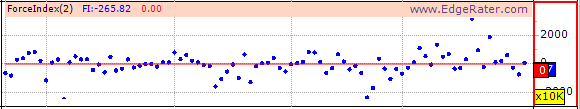
ForceIndex with PointDot attribute
Attributes can also be specified by using the @SETATTR function. These two pieces of script are equivalent.
FI: EMA(RAW, N),PointDot;
FI: EMA(RAW, N);
@SETATTR(FI, 'PointDot');
List of available attributes:
|
Attribute |
Effect |
|
ColorStick |
The output is displayed as sticks, with positive values colored green and negative values colored red. See screen shot above. |
|
VolStick |
The output is displayed as sticks, but only positive values are shown, the stick is colored green if the close price of the stock was higher than the previous day, and red if the close price was lower (the VolStick attribute is primarily intended for use with the Volume formula). See screen shot above. |
|
CrossDot |
See screen shot above |
|
PointDot |
See screen shot above |
|
CircleDot |
See screen shot above |
|
|
|
|
HighSpeed |
This smoothing mode renders faster but with some edge effects |
|
HighQuality |
This smoothing mode renders slower but with better quality |
|
|
|
|
VCenter |
If a formula produces text output, this sets the vertical alignment |
|
Top |
If a formula produces text output, this sets the vertical alignment |
|
Bottom |
If a formula produces text output, this sets the vertical alignment |
|
|
|
|
Right |
If a formula produces text output, this sets the horizontal alignment |
|
Left |
If a formula produces text output, this sets the horizontal alignment |
|
|
|
|
Color |
Sets the color of the output line, must be followed by an actual color as in ColorBlue |
|
Width |
Sets the width of the output line, must be followed by a value for width as in Width3 |
|
Brush |
Sets the brush style if applicable. For instance the FILLRGN function uses a brush to render the fill. Must be followed by a value for the brush in the format: #AARRGGBB, Where AA = Value for alpha value (transparency) (Hex values in range 00-FF) RR = Amount of Red (Hex values in range 00-FF) GG = Amount of Green (Hex values in range 00-FF) BB = Amount of Blue (Hex values in range 00-FF) Eg: Brush#20808080 which specifies a semi-transparent gray color (equal amount of RGB) |