The Daily Equity Report shows how your trading account would have performed on a daily basis. It takes into account the portfolio cash and the value of any open stock positions for each and every day of the simulation.
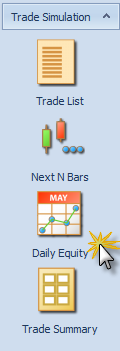
Step: Select the ‘Daily Equity’ report from the trade simulation navigation bar
Trade Simulation Navigation Bar – Click on Daily Equity
The following chart will be displayed:
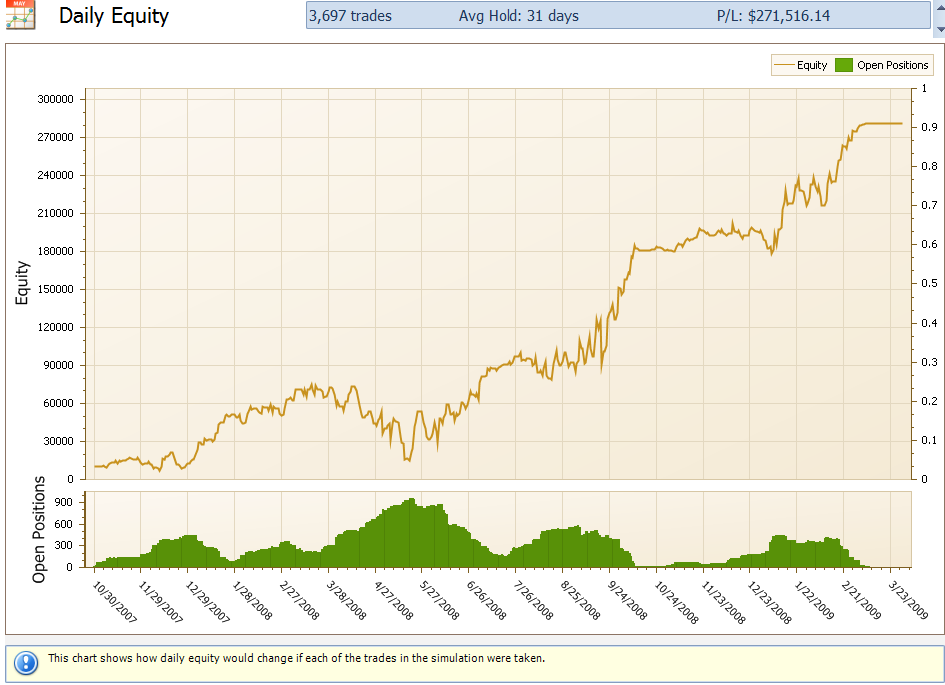
Daily Equity Chart
The upper area of the chart shows an equity line and the lower area shows the number of positions that are open on each day.
The open positions view is useful to determine if it would even be possible to trade such a strategy, for instance in the above chart the maximum number of open positions was around 900 (not limited to account size) and the amount of capital you would require to trade such a strategy would be equal to the maximum number of open positions multiplied by the dollars per trade, which you need to take into account to determine whether such a strategy is right for you.
The actual numbers behind this chart can be viewed by opening up the report using the ‘View Spreadsheet’ button and looking at the ‘Daily Equity Data’ worksheet:
Step: click on the ‘View Spreadsheet’ button.
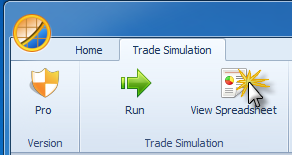
The View Spreadsheet button
Step: click on the ‘Daily Equity Data’ worksheet.
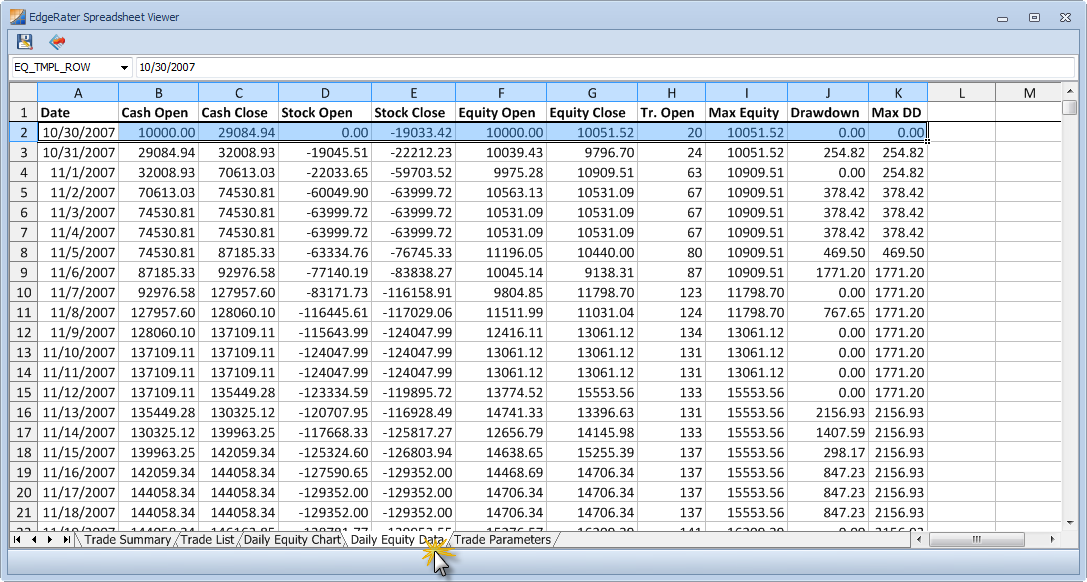
The Daily Equity Data worksheet of the Trade Simulation report
Note that the entire report can be saved as an Excel spreadsheet.