Typically, a ChartScript indicator is built to calculate a particular technical analysis function and display the results of that function in the chart area in which it is placed.
A chart area can contain multiple ChartScript indicators.
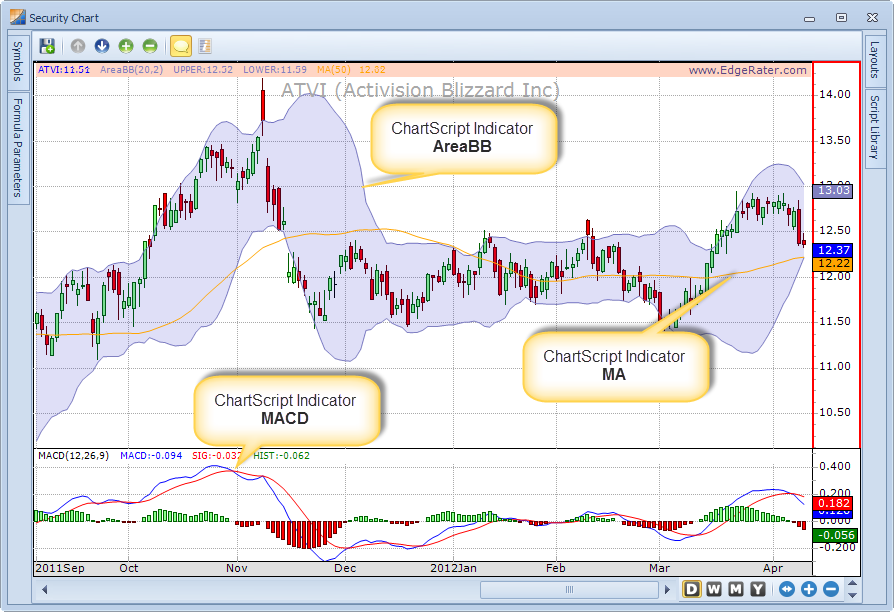
In the screenshot the upper area contains two ChartScript indicators:
Ø An AreaBB indicator which is a Bollinger band indicator rendered as an area fill so that the area between the bands is filled with a semi-transparent fill color.
Ø A MA indicator which is a moving average of the close price of the stock
A single ChartScript can output multiple lines.
In the screenshot the lower area contains only one ChartScript indicator - a MACD indicator which renders as three separate outputs (two lines and a histogram).