
The CCI (Commodity Channel Index) is a versatile indicator that can be used for many different types of trading (Trends, Reversals, Continuation plays, Cycles, etc). Originally Donald Lambert invented CCI to be used as a breakout indicator: a long entry signal is generated when the CCI crosses above +100 and a short entry signal is generated when the CCI crosses below -100;
Article References
Stocks and Commodities magazine has some great articles on CCI, I have included a couple of references here. If you are a subscriber to Stocks and Commodities magazine you can use the links below the references to go directly to the PDF version of the articles. If you are not a subscriber you can purchase the articles separately or subscribe using the lower links.
The original article on CCI by Donald Lambert:

V.1:5 (120-122): Commodity Channel Index: Tool for Trading Cyclic Trends by DONALD R. LAMBERT
http://technical.traders.com/archive/articlefinal.asp?file=\V10\C02\COMMODI.pdf
A comprehensive look at different trading techniques using CCI by Barbara Star:

V.10:2 (67-74): The Commodity Channel Index by Barbara Star, Ph.D.
http://technical.traders.com/archive/articlefinal.asp?file=\V10\C02\COMMODI.pdf
Individual Article Purchase Links:
- V.1:5 (120-122): Commodity Channel Index: Tool for Trading Cyclic Trends by DONALD R. LAMBERT
- V.10:2 (67-74): The Commodity Channel Index by Barbara Star, Ph.D.
Or subscribe to the magazine and get access to the entire digital archive:

Using CCI for trading Trends and Snapbacks
In this post I will focus on a specific use of CCI as taught and used by George Lea, which he learned and adapted from the late David Elliott (Market timing trader and mentor).
The Zoom Zone for Trends
The first use is to trade trends when stocks enter the ‘Zoom Zone’. A ‘zoom up’ is when the CCI(50) is above +100 and a ‘zoom down’ is when CCI(50)is below -100. This corresponds to Lambert’s original concept for CCI. The following chart shows Zoom Ups in DOW Chemical:

DOW Chemical Zoom Up Zones, CCI(50) > +100
In the above chart the Zoom Up Zones are shaded in Green in the lower chart area. When CCI(50) crosses above +100 a long trade can be initiated and when CCI(50) crosses back below +100 the trade can be exited. You can see that the longer the Zoom Zone the greater the gain, short duration zoom zones indicate whipsaw action.
Zoom Down is when CCI(50) crosses below -100 as shown in the following chart:
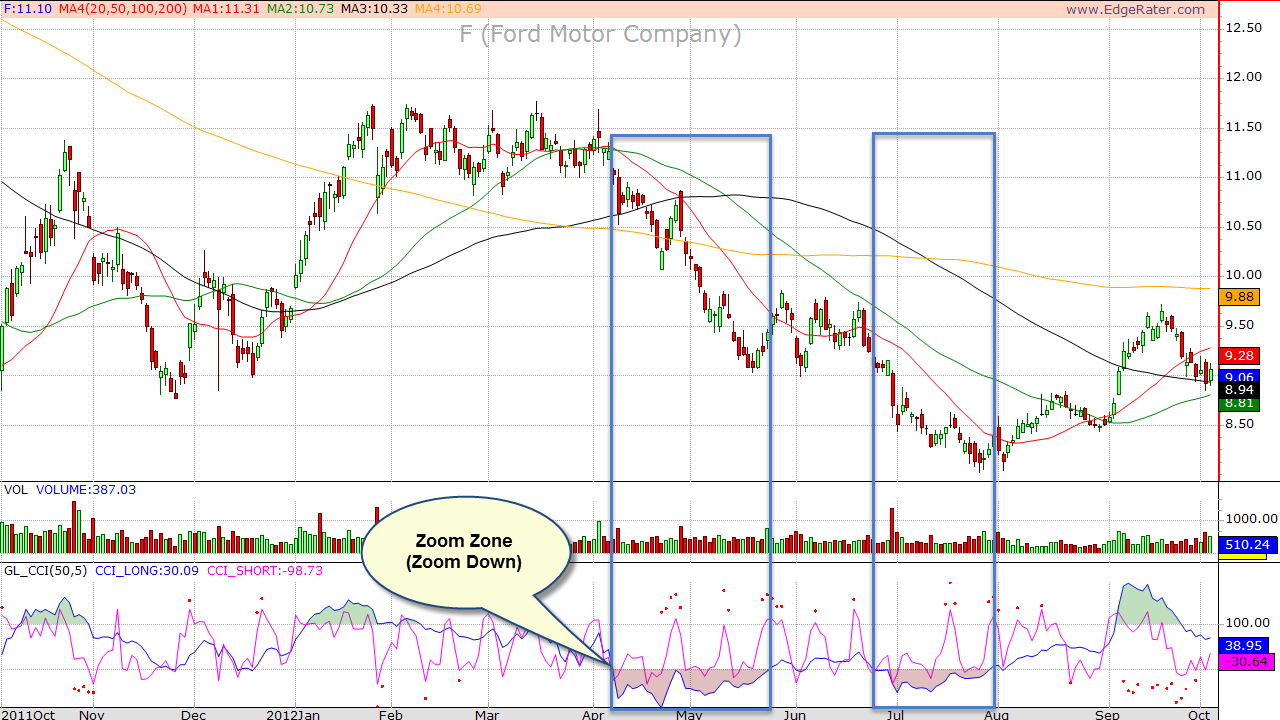
Ford Motor Zoom Down Zones, CCI(50) < -100
In the above chart you can see two Zoom Down zones for Ford Motor Company. The chart also contains a few Zoom Up zones. A short side trade can be entered when CCI(50) crosses below -100 and exited when CCI(50) crosses above -100.
The Snapback for Continuation Plays
 By combining the longer term CCI with a shorter term CCI you can see when quick moves against the long term direction are occurring and when those moves start to Snapback to resume the longer term trend. George teaches using the 50 period CCI for the longer term and a 5 period for the shorter term.
A Snapback is ‘Ready’ when the difference between the two indicators is greater than 150 points. A snapback ‘Fires’ when the difference was greater than 150 points on the prior bar and is less than 150 points on the current bar.
Snapbacks can occur whether the CCI is in Zoom or not but it is suggested that stronger snapbacks occur during Zoom.
Think of the snapback ‘ready’ as a bow being drawn back as price retraces against a strong trend. The snapback ‘fire’ signal is an indication that the pressure has been released, the arrow has been fired and the stock has momentum that will take it towards and beyond the most recent highs or lows.
Here’s an example of a stock in a downtrend showing Zoom Zone (shaded red area) and snapback ‘ready’ dots (also known as cherries). When the cherries disappear the snapback signal is fired.
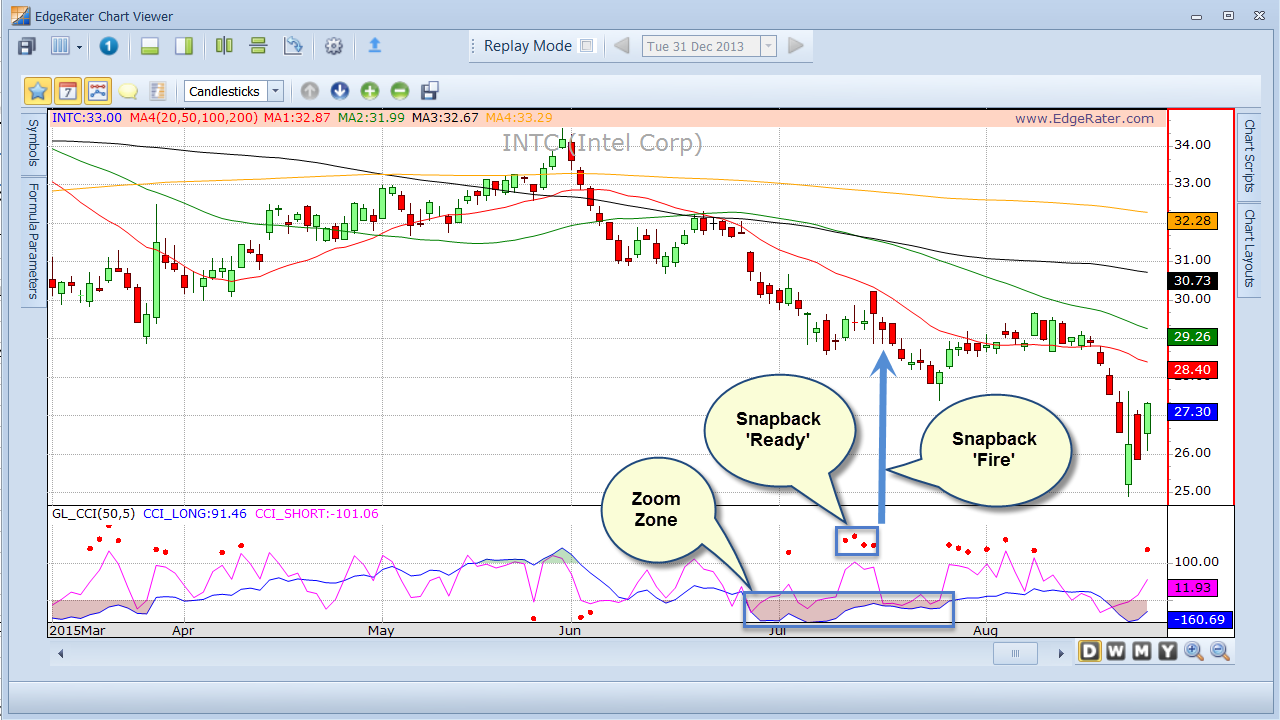
Example of Snapback ‘Down’
Snapbacks can occur in either direction. For a snapback ‘Up’ to occur during zoom the long term CCI would need to be in the Zoom Up zone (above +100), the short term CCI would need to have moved more than 150 points below the long term CCI (Ready Condition), and the Snapback ‘Fire’ condition would occur once the difference between the two CCIs is less than 150 points.
Here’s an example of a Snapback Up:
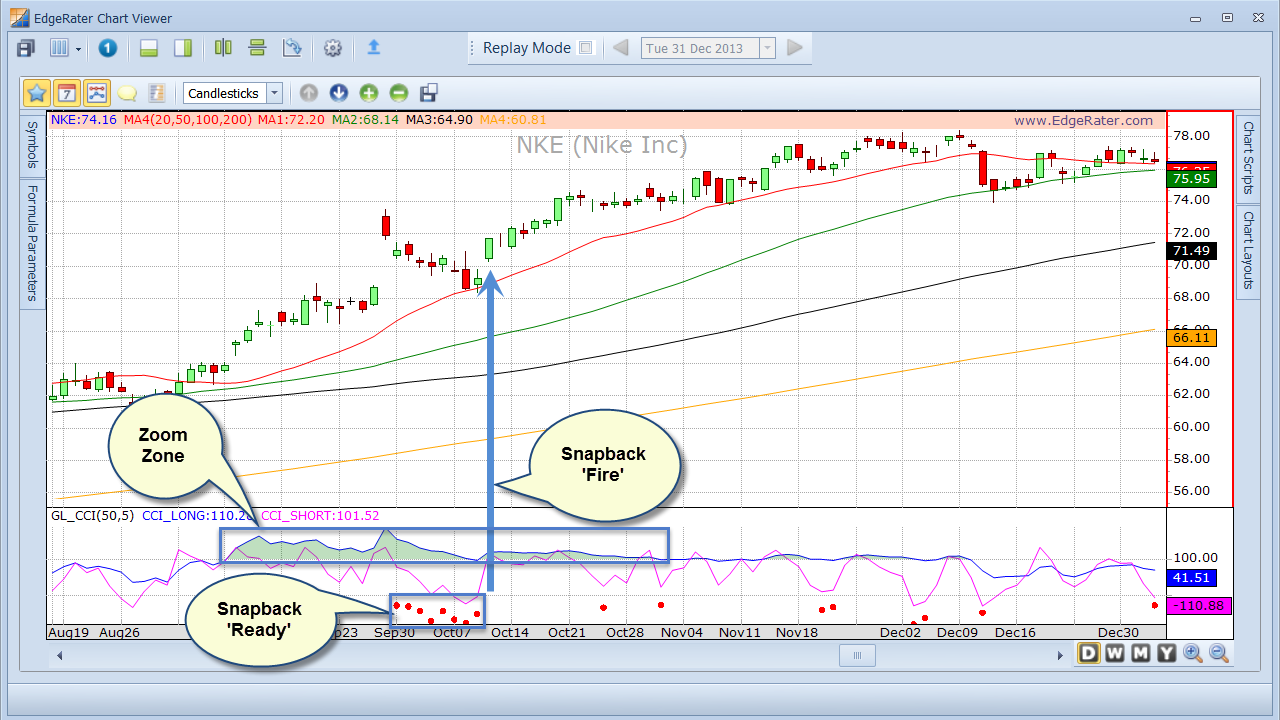
So, the Snapback is the signal that a continuation of longer term trend will resume.
How to find Zoom Zone and Snapback trades
Most charting programs contain the CCI indicator. For Zoom Zones just look for cases where the CCI(50) is above 100 or below -100. To find Snapbacks you would need to add the CCI(5) indicator and find charts where the difference between the CCI(50) and CCI(5) is more than 150.
Most people would rather have a software program show them a complete report of all stocks that meet the criteria, allowing chart viewing as necessary to confirm signals. That’s where EdgeRater PRO Unleashed and the new CCI Trends and Snapbacks template comes in.
EdgeRater PRO trading software contains a template that will report all stocks that are currently in Zoom, how long the current zoom has lasted, the zoom direction and % move during the current zoom. The same report also shows stocks that are ready for a snapback and where the snapback has just fired. The template reports all this information for Daily, Weekly and Monthly time periods.
Here’s a screenshot of the report:
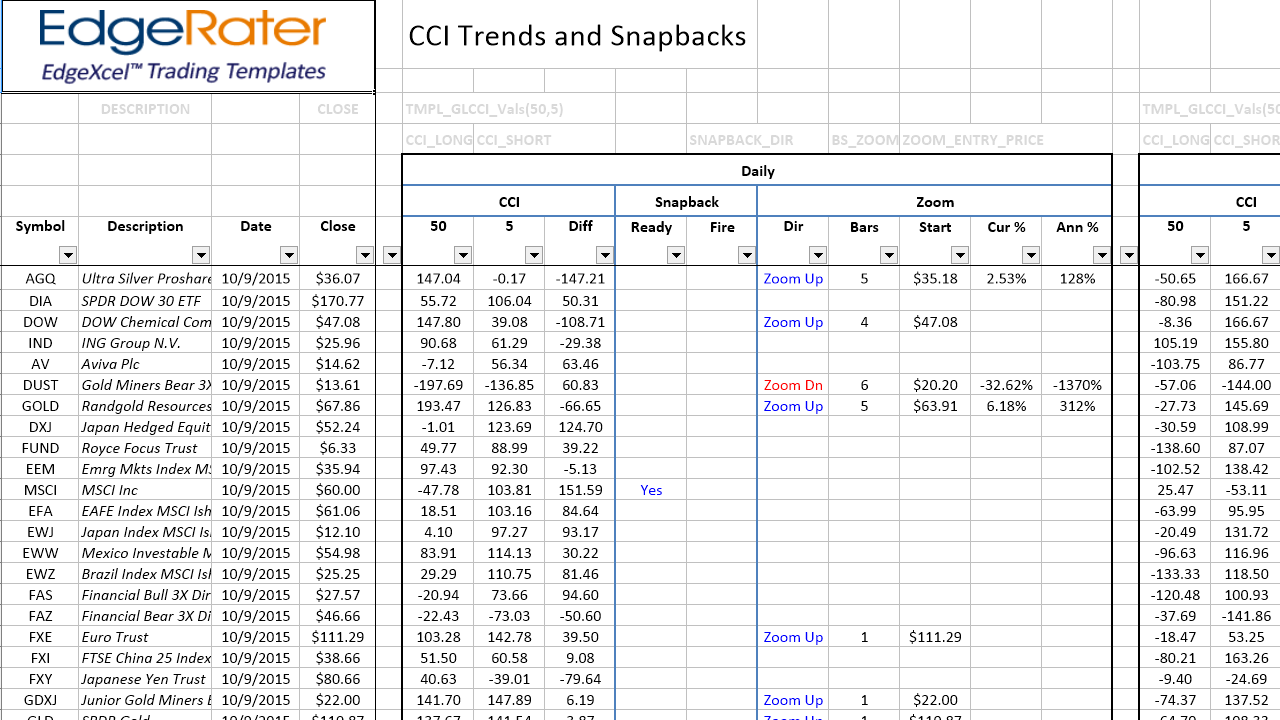
The EdgeRater CCI Trends and Snapbacks Report
While viewing the report the CCI chart will update to reflect the stock row that is currently selected, allowing an easy way to further analyze these signals.
Summary
The CCI indicator has many uses but in this article I specifically focused on Trends and Snapbacks as taught by George Lea and learned from David Elliott.
Zoom Zones are indications of trends. A long side trend trade can be entered when the CCI(50) crosses over the +100 level and exited when CCI(50) crosses below +100. A short side trend trade can be entered when the CCI(50) crosses under the -100 level and exited when CCI(50) crosses back above -100.
Resumption of trend after a counter trend move is indicated by a Snapback. When the CCI(5) gets more than 150 points away from CCI(50) the bow is drawn and when the difference goes back below 150 the snapback has been initiated or ‘fired’.
You can easily find CCI Trends and Snapbacks using EdgeRater PRO Unleashed. The ‘CCI Trends and Snapbacks’ template is under the ‘George Lea’ category of templates.