
What is Seasonality Trading?
The idea behind seasonality trading is to find specific times of year when a stock consistently trends upwards or downwards. Seasonality doesn’t attempt to identify why a stock moves at a particular time of year, just that it does and does so consistently. To that end there are a few statistics that the seasonality trader likes to know.
- How many years did the stock move up over a chosen time-frame
- How many years did the stock move down over the same time-frame
- What was the average % gain or loss over all the up and down years.
For instance, the seasonality trader would find the following information useful:
“Over the prior 10 years in January Netflix (NFLX) has moved up 8 out of 10 years and down 2 out of 10 years with an average gain of 23%”
Seasonality in EdgeRater
The Seasonality Trading templates in EdgeRater produce complete reports that concisely answer the seasonality question for every stock in your symbol list. The seasonality templates are contained in the category ‘Annual Trends’. There are 5 templates that show the seasonality statistics for 5 different time periods:

The Annual Trends Category contains the Seasonality templates
| Monthly 1-Month | Shows the Avg, #Up and #Dn statistics for all stocks in your symbol list for each of the 12 months of the year, assuming the stock was purchased on the first trading day of the month and sold on the last trading day of the month |
| Monthly 2-Months | Shows the Avg, #Up and #Dn statistics for all stocks in your symbol list for each of the 12 months of the year, assuming the stock was purchased on the first trading day of the month and sold on the last trading day of the following month |
| Monthly 3-Months | Shows the Avg, #Up and #Dn statistics for all stocks in your symbol list for each of the 12 months of the year, assuming the stock was purchased on the first trading day of the month and sold on the last trading day of the 3rd month |
| Monthly 4-Months | Shows the Avg, #Up and #Dn statistics for all stocks in your symbol list for each of the 12 months of the year, assuming the stock was purchased on the first trading day of the month and sold on the last trading day of the 4th month |
| Now | Shows the Avg, #Up and #Dn statistics for all stocks in your symbol list assuming that the stock was purchased on the first trading day after the current date in each of the prior years and sold after holding for one of the following time periods:
|
Here’s an example report produced by the Monthly 1-Month template
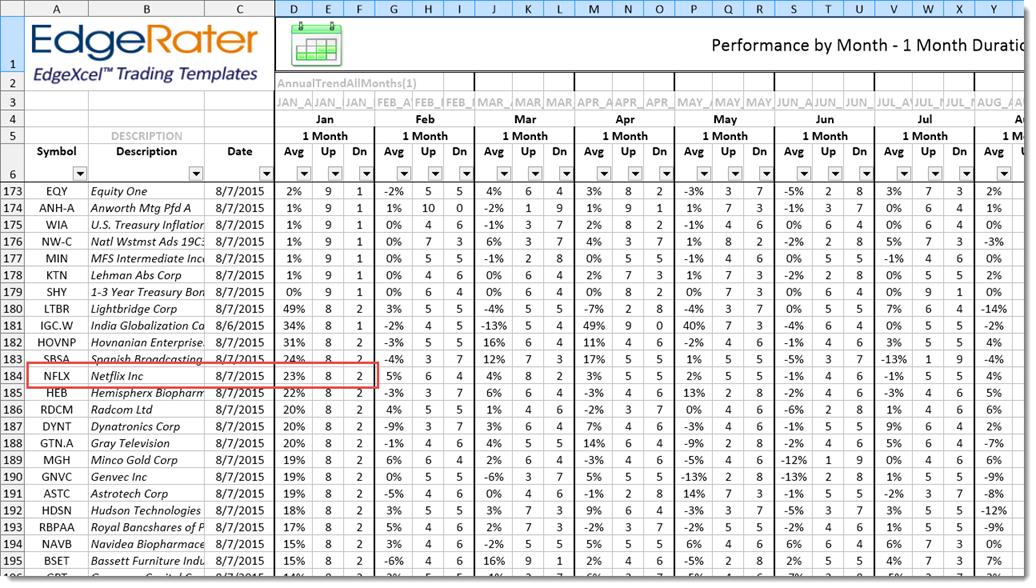
From this report you can see the statistic mentioned at the beginning of the post: In the last 10 years Netflix (NFLX) has had 8 up years and 2 down years during January with an average gain of 23%.
The first 4 of the templates give the seasonality statistics based on fixed start and stop dates every year, for instance Jan 1st to Jan 31st.
The last template called the ‘Now’ template is dynamic and calculates the seasonality statistics based on today’s date. It attempts to answer the question “What has upcoming seasonality moves”. Where upcoming means based off a start date of tomorrow.
Here’s an example report produced by the ‘Now’ Template.

In this example we can see that Netflix (NFLX) had an average 1% gain with 5 up years and 5 down years over the last 10 years during the 10 trading days starting on the first trading day after August 7th.
Looking at the 2 month columns (J through L) we can see that Netflix had an average 6% gain with 8 up years and 2 down years during the 2 months starting on the first trading day after August 7th.
The reports can be sorted and filtered by clicking the down arrows in the header row (row 5). So you could easily just look for stocks that had a 10 and 0 up to down statistic for any of the time frames.
Summary
The EdgeRater Seasonality Trading templates give compact and concise seasonality statistics for a number of different time periods. When you want to know what performs well in a given month, use the 1-Month template. When you want to know what performs well at the current time of year, use the ‘Now’ template.
You can try EdgeRater PRO for free for 30 days by visiting the product page. Remember there’s no credit card required to try the software for free.