
 The book ‘Buy The Fear Sell The Greed’ by Larry Connors contains 7 behavioral quant strategies for traders. This post reviews the first strategy in the book named ‘RSI PowerZones’ and shows how to view strategy signals and how to backtest along with backtest results.
The RSI PowerZones Strategy
The rules for the strategy are simple:
- SPY must be trading above the 200 day simple moving average
- Buy 1st unit of SPY on the close when the 4 period RSI crosses under threshold level1
- Buy a 2nd unit of SPY on the close when the 4 period RSI crosses under threshold level2
- Sell entire position when the 4 period RSI crosses above the exit threshold level.
Threshold levels
The book has tested the following threshold levels:
- (30,25,55) ie. level 1 = 30, level 2 = 25, exit level = 55
- (25,20,55) ie, level 1 = 25, level 2 = 20, exit level = 55
and states 90.59% profitable trades with (30,25,55) and 92.52% profitable trades with (25,20,55)
Testing the strategy with EdgeRater
 I designed EdgeRater to make it easy to test strategies like this. The remainder of this post will show some of the trade examples, how to view strategy signals for any symbol (not just SPY) and how to backtest using the built in script. All examples are using the (25,20,55) version of the strategy.
Trade Examples
This chart shows the 5 most recent trades that occurred in 2018. This is also the period where SPY dropped into bear market territory with an 11% decline in the early part of the year.
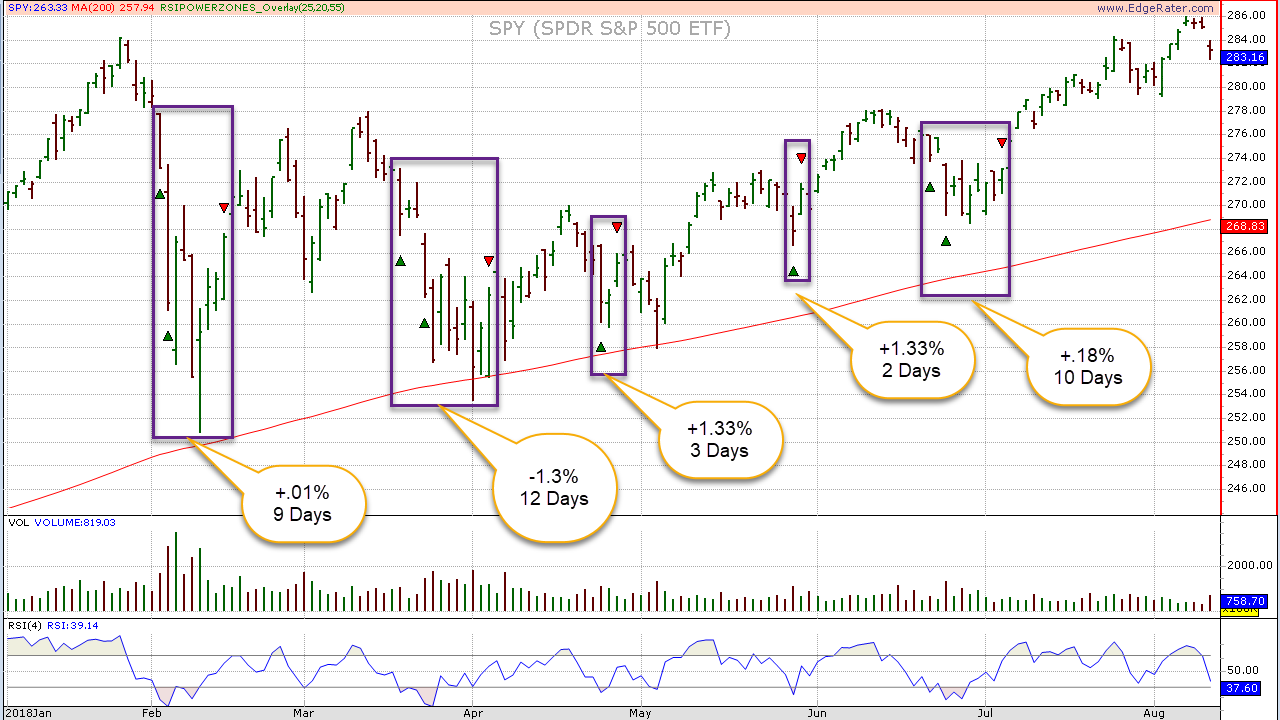
This market period was challenging for traders and 1 of the 5 trades was a losing trade, 2 trades barely broke even and 2 trades had just about the average trade return for all trades since 1993.
Now let take a look at 2017,
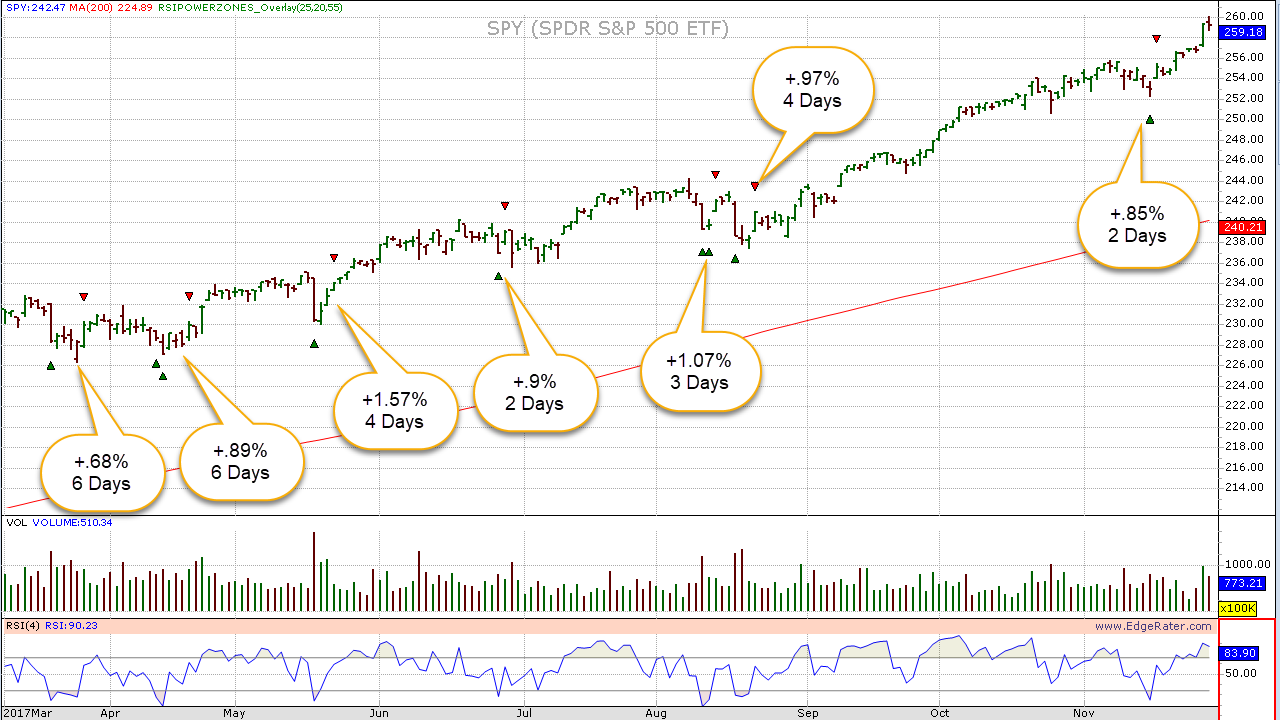
You can see there were 7 trades during this rising market period, all of which were profitable.
How To Test RSI PowerZones in EdgeRater
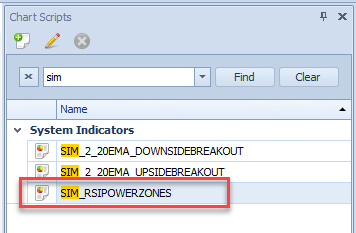
The EdgeRater August 2018 update includes a simulation script named ‘SIM_RSIPOWERZONES‘ which can be found in the script library:
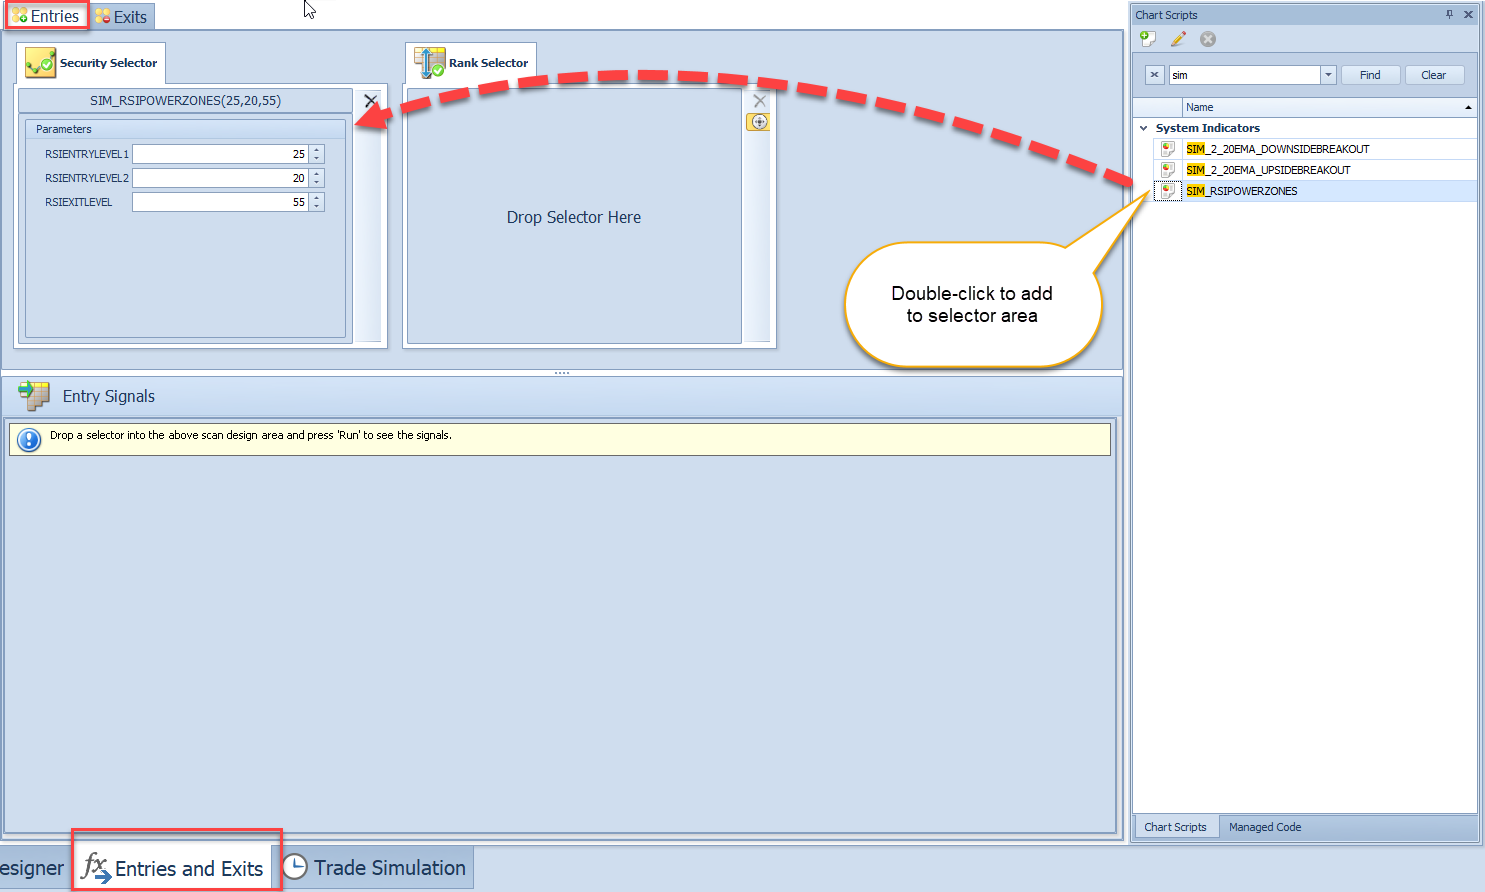
The Entries and Exits tab is where backtesting starts. The idea is to generate a series of entry and exit events which will then be used within the trade simulation tab where you can define portfolio rules such as allowing duplicates and dollars per trade.
The script SIM_RSIPOWERZONES is a special edgerater script in that it generates both entry and exit signals rather than using two separate scripts, one for entry and one for exit. To use it just double-click it to add it to the Entries selector area:
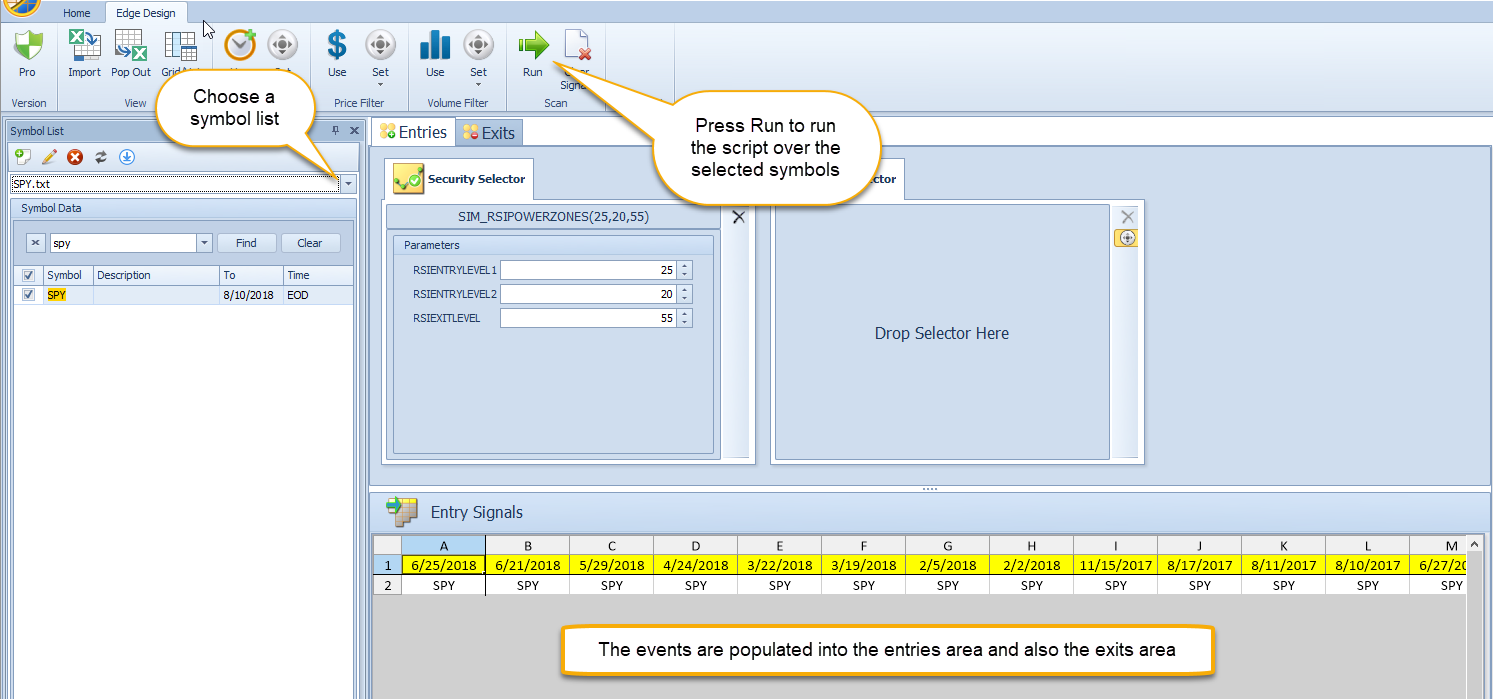
Then choose a symbol list containing your desired symbols (in this case SPY) and press the Run button to run the script over your symbol list and produce entry and exit signals
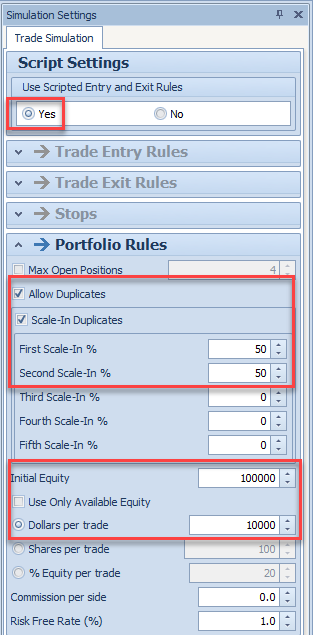
Next head over to the Trade Simulation tab and for this particular simulation choose the following settings:
Then press Run to run the simulation with the current contents of the Entries and Exits tab (which contains entry and exit signals due to the previous step).
This produces the final Trade Simulation report containing a Trade List, P&L distribution chart, Daily Equity Chart and Trade Summary statistics.
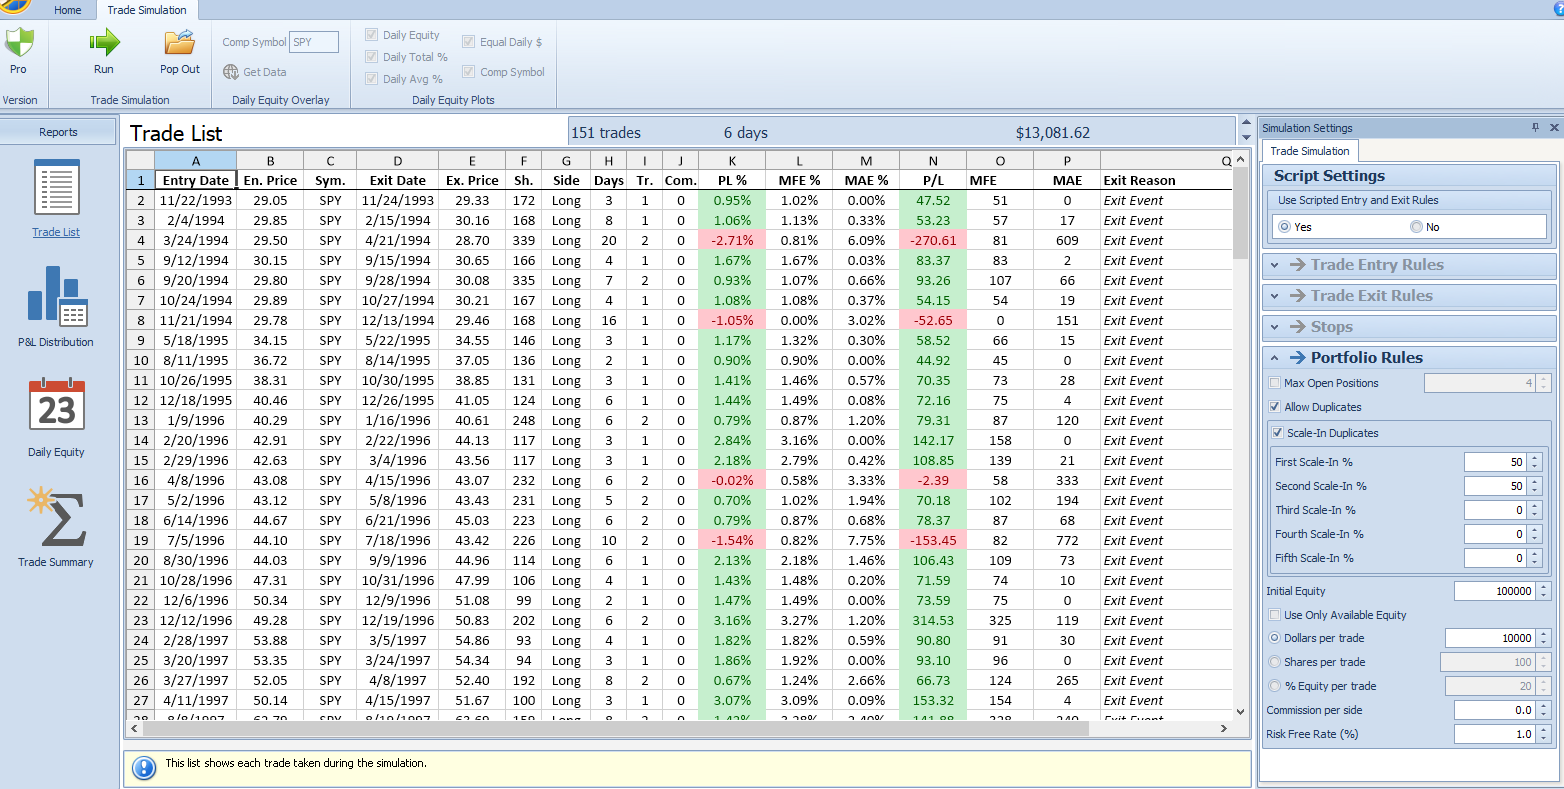
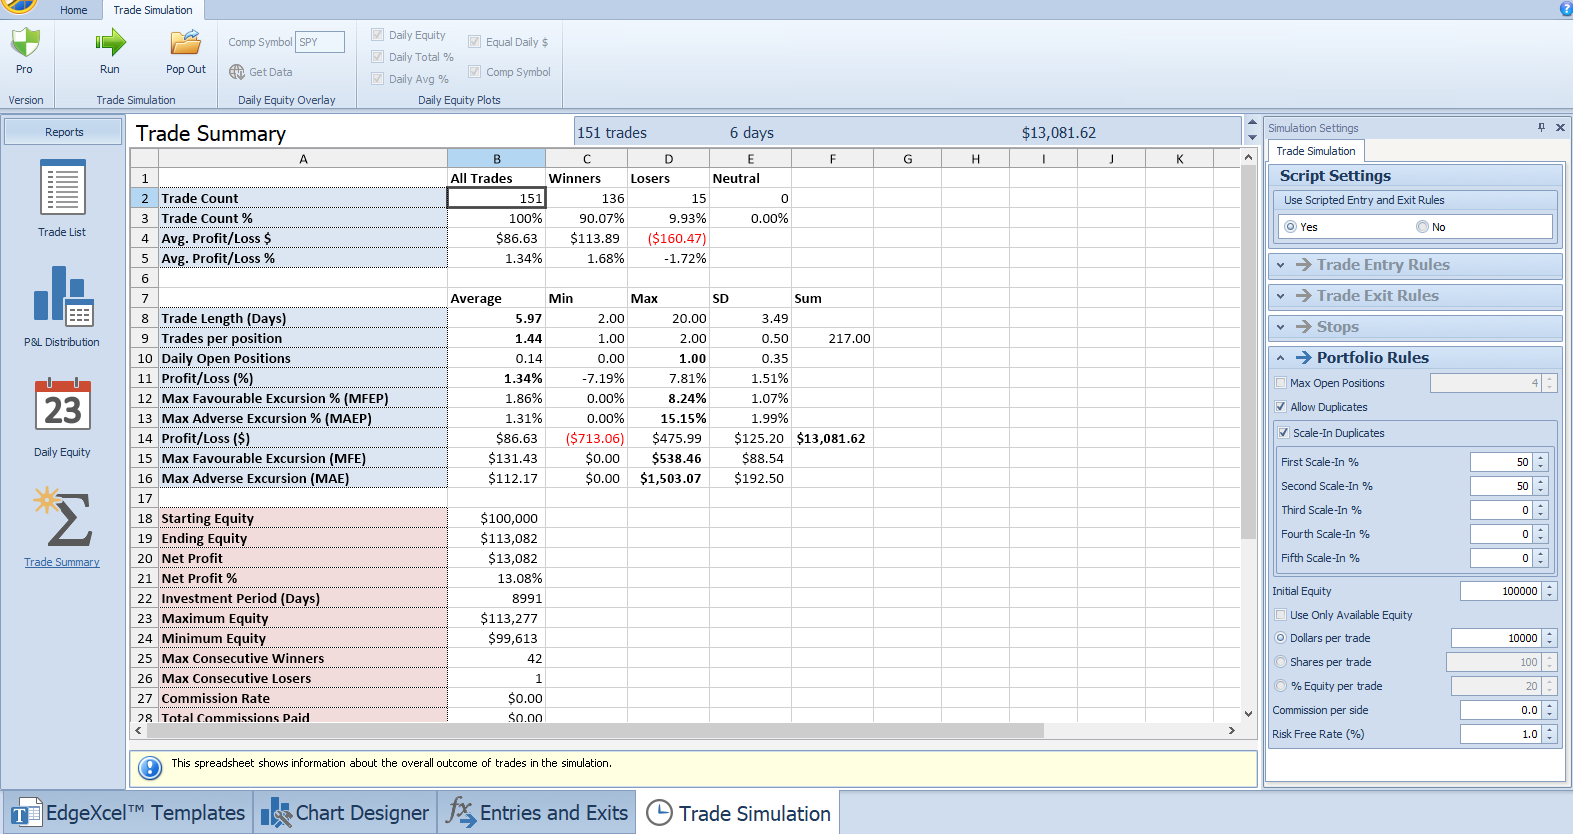
Using the SIM_RSIPOWERZONES script and SPY data going back to 1993, the strategy shows 136 winners and 15 losers for a 90% win rate with an average P/L per trade of 1.34% and and average hold period of 6 days.
Of course you can test this same script on any symbol in your list or even multiple symbols at once.
RSI PowerZones Template
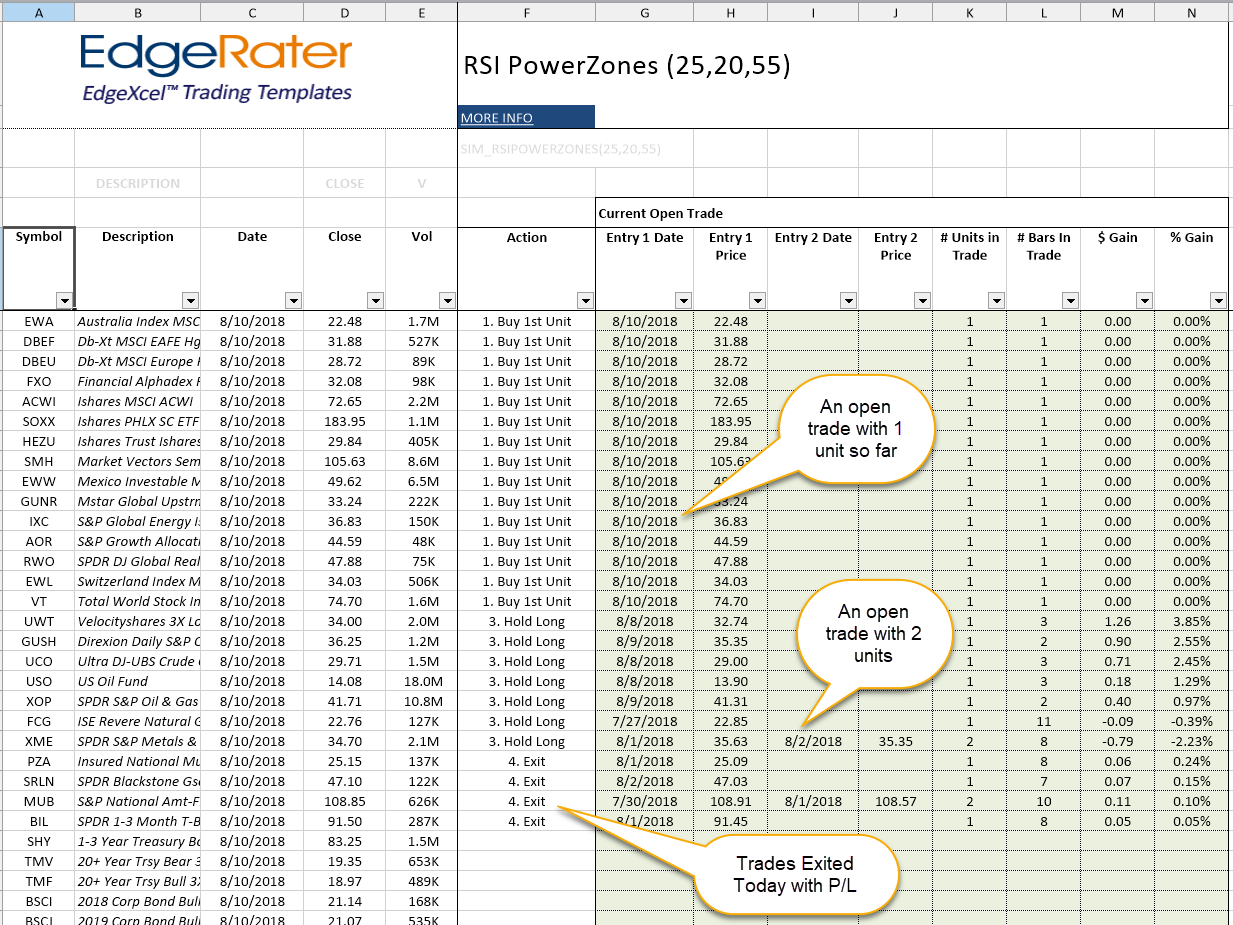
The August 2018 update of EdgeRater includes the new RSI PowerZones template which allows you to monitor all signals generated by this strategy on a daily basis for all symbols in your selected symbol list.
Every time you run this template you will be notified of any new action such as:
- Buy 1st unit
- Buy 2nd unit
- Hold
- Exit
In addition the template will keep you informed of the current performance of every open trade. Here’s an example of the template report generated using a list of liquid ETFs.
Summary
The RSI PowerZones strategy from the book Buy The Fear Sell The Greed by Larry Connors has produced 90% winning trades in SPY since inception (1993). Using the SIM_RSIPOWERZONES script in EdgeRater it is possible to easily backtest and verify these results and also to test on other symbols. You can also use the new RSI PowerZones template to monitor all daily buy/sell/hold actions occuring in your chosen symbols and to keep track of current open positions.
This is all available in the permanent license edition of EdgeRater (called EdgeRater PRO Unleashed) and the subscription version called EdgeClub.