
 The book ‘Buy The Fear Sell The Greed’ by Larry Connors contains 7 behavioral quant strategies for traders. This post reviews the Crash strategy and shows how to view strategy signals. At the end of the post there’s a section on my own independent test results and an interesting piece about whether you should take additional entries in a stock if you already have an open position in that stock.
The Crash Strategy Rules
When all of these conditions are true:
- Closing price > $5
- 21 Day Average Volume >= 1 million shares
- Historical Volatility (100 Day) >= HV THRESHOLD (100%, 80%, 60%)
- ConnorsRSI(3,2,100) >= 90
Short the stock the next day on a Limit order X% Higher than today’s close (X=3% or 5%)
Exit the stock when ConnorsRSI(3,2,100) < CRSI EXIT THRESHOLD (30, 20)
Threshold levels
The book primarily tested the difference between using a next day short entry limit order at 5% vs 3% and a Connors RSI Exit level of 30 vs 20. The parameters of 5% and 30 give a good system with roughly 72% winning trades and 5% average profit. Using the parameters 5% and 20 results in a higher % of winning trades and higher average % profit but suffers from much longer average days held (12 vs 4) and bigger drawdowns.
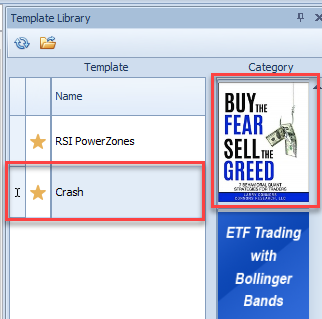
Viewing Current Trades and Signals in EdgeRater
To view current trades and signals in EdgeRater run the Crash template which can be found in the Buy The Fear Sell The Greed category of templates
The result of running this template is the following report. Note that I chose a prior day (6/18/2018) for the report as there are no signals on the day I prepared this blog post.

The report will show 4 significant actions
Setup Criteria Met: The current bar meets all criteria for a setup bar. The Next Bar Short Limit column indicates the limit level to enter for the next trading day. If running the template at the end of the day using end-of-day data then this is the limit level to enter into your trading platform for the following day. If running this template using Intraday data then setups should be ignored until the day’s bar is complete.
Short Entry: The current bar has triggered a short Entry at the price indicated by the prior bar (Calculated by X% above the prior bar close). If the template is run at the end of the trading day using end-of-day data then the entry has occurred during the day’s session. It is too late to enter the trade if you are following the strategy rules. If running this template using intraday data in the middle of the session then the entry has occurred at some point during the session. If you can get a trade at the limit price then you will still be following the strategy rules by taking it during the day.
Hold Short: A trade was entered prior to the current bar and has not yet exited. There is an existing trade and the green shaded area shows the trade details.
Exit: The current bar has signaled an exit and the trade has completed. The shaded green area shows the completed trade details. Note that if running this template intraday, any exit signaled does not qualify as an exit unless it is the end or close to the end of the trading day. This is because the strategy is based on end-of-day exits. If you exit in the middle of the trading day you are not following the prescribed strategy. A signal fired close to the end of the trading day (for example within the last 20 mins) can be considered valid.
Double-clicking on any of the rows in the report will show a chart with the strategy indicators applied:

Testing the strategy with EdgeRater
 I designed EdgeRater to make it easy to test strategies like this. The remainder of this post will show some of the trade examples, how to view strategy signals for any symbol and how to backtest using the built in script.
The Script
The EdgeRater Crash script is called SIM_CRASH and has four parameters:
- HVLEVEL The Historical Volatility threshold level to qualify an entry
- CRSILEVEL The ConnorsRSI level to qualify an entry (book did not test this)
- LIMITLEVELPCT The % above today’s close for a next day short limit level
- CRSIEXITLEVEL The ConnorsRSI level to signal an exit
The default parameters are
- HVLEVEL: 100
- CRSILEVEL: 90
- LIMITLEVELPCT: 5
- CRSIEXITLEVEL: 30
which is represented by the shortcut notation: (100, 90, 5, 30)
Trade Examples
So, what does a Crash trade actually look like? Here are a few examples
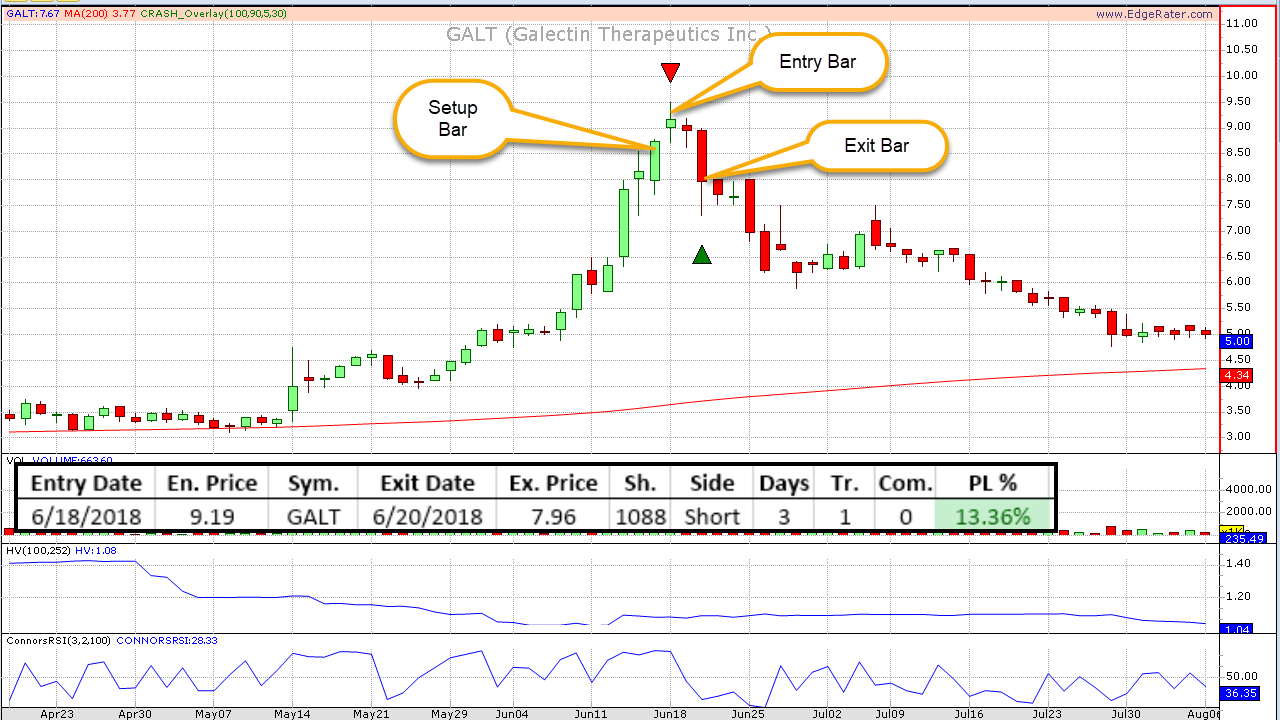
GALT Crash Trade Example
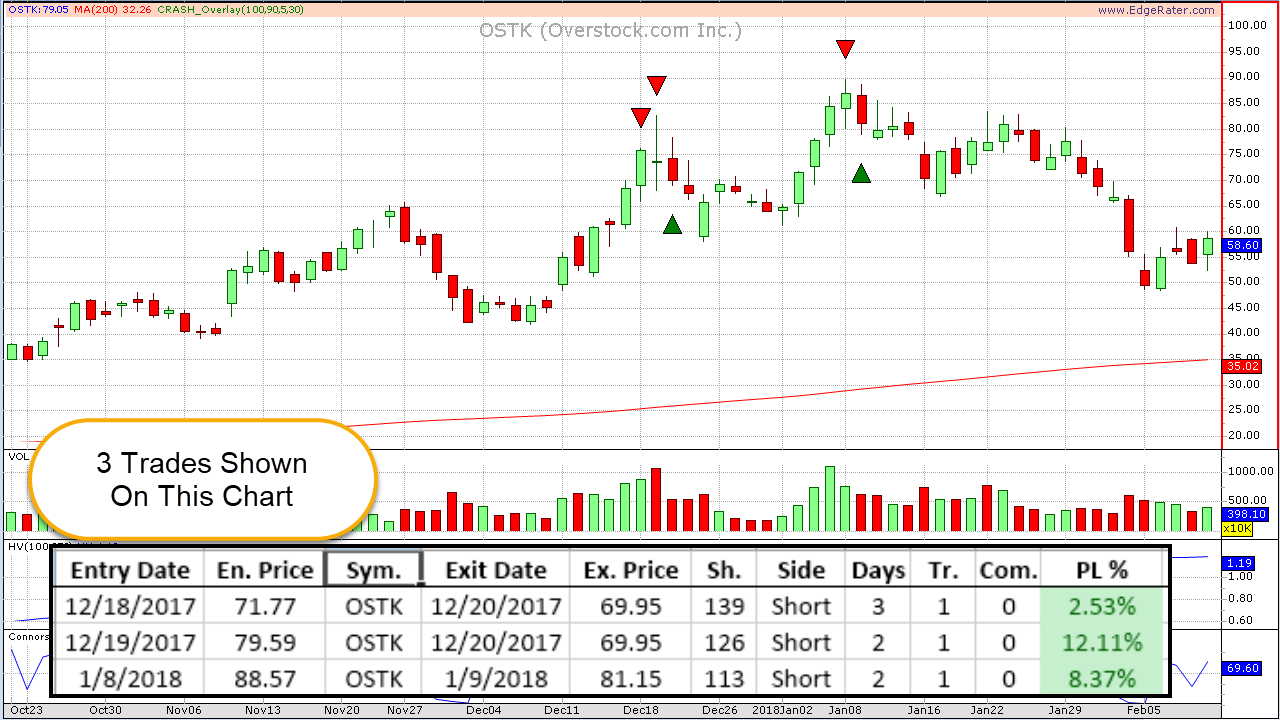
OSTK 3 Crash Trades
The above OSTK chart shows 3 trades but also note that the 2nd trade was signaled while the first trade was still open.
Duplicate Entries
That leads to an interesting question and one that isn’t answered in the book: Should you take additional trades in the same stock if you already have a trade open in that stock?
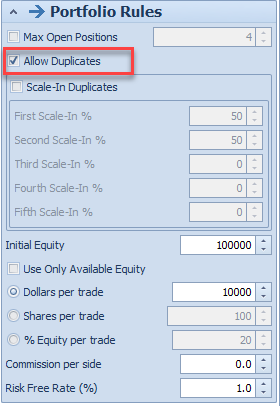
Using EdgeRater we are easily able to test the difference. There’s a setting in the Trade Simulation tab under Portfolio Rules called ‘Allow Duplicates’ which allows us to run the simulation for both cases.
Here are the stats for running with and without duplicates:
| #Trades | Win % | Avg Win % | Avg Loss % | Profit Factor | Avg Days Hold | |
|---|---|---|---|---|---|---|
| With Duplicates | 421 | 70% | 14% | -15% | 2.22 | 5 |
| Without Duplicates | 309 | 68% | 13.5% | -15% | 1.93 | 5 |
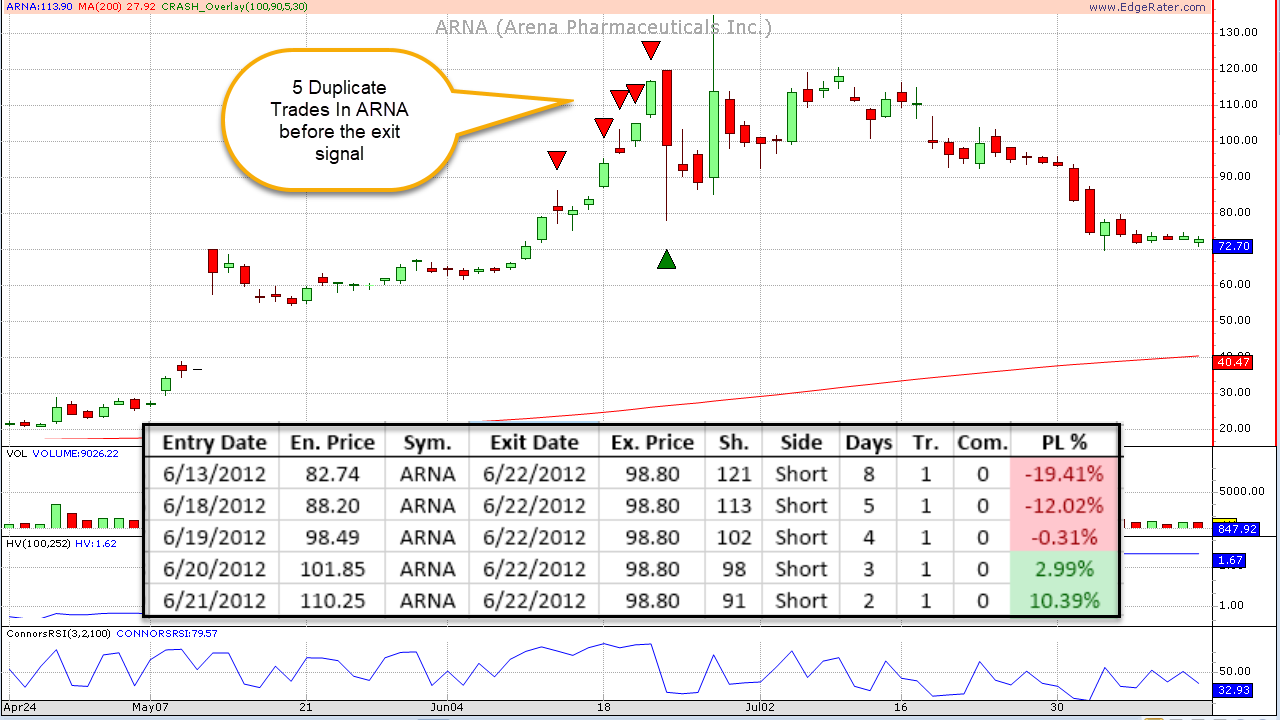
On the face of it, based on the stats, it’s better to take all duplicate trades but really that might not be the best answer as you will then be exposed to more risk in that stock. Consider this case in ARNA where 5 trades in the same stock were signaled on different days before an exit was signaled.
Out of the 309 trades (prior to any dupes), 79 entered into at least 1 more trade before the exit and so you should expect 79/309 or 25% of your trades to fire additional entries.
Over the entire 10 year test period the maximum number of duplicate trades for any one stock was 5 and that happened twice. Once in ARNA as shown above and once in REN. Obviously, every time an additional entry is fired each prior position is running at a loss. That has the potential to build up to a large loss before any exit is signaled.
Here’s a breakdown of the number of open trades and entries:
- Exactly 5 entries: 2
- Exactly 4 entries: 3
- Exactly 3 entries: 21
- Exactly 2 entries: 53
- Exactly 1 entry: 309
Summary
The Crash strategy from the book Buy The Fear Sell The Greed by Larry Connors has produced 70% winning trades across all stocks in the EdgeRater database over the last 10 years (ending Sept 2018). Approximately 25% of all trades that were open fired additional entry signals whilst open. Statistically it worked out better to take those additional entries and the max number of entries seen was 5. However taking more exposure on a losing position can lead to excessive risk.
You can use the new Crash template in EdgeRater to monitor all daily buy/sell/hold actions occurring in your chosen symbols and to keep track of current open positions.
This is all available in the permanent license edition of EdgeRater (called EdgeRater PRO Unleashed) and the subscription version called EdgeClub.